
ON1010 Research Guide
U.S. Treasury Market Guide
Bills, notes, bonds, TIPS, and what Treasury yields tell you about the economy.
The U.S. Treasury market is the largest and most liquid fixed-income market in the world, with over $26 trillion in outstanding debt. Treasury yields serve as the benchmark “risk-free” rate against which virtually every other financial asset is priced — from corporate bonds and mortgage rates to stock valuations and international lending rates. Understanding how the Treasury market works, what different maturities signal, and how yields move is essential for any serious investor.
Key concept: Treasury yields and prices move in opposite directions. When investors buy Treasuries (demand increases), prices rise and yields fall. When investors sell (demand decreases), prices fall and yields rise. This inverse relationship is the most fundamental mechanic in fixed-income markets.
Types of Treasury Securities
The U.S. Department of the Treasury issues several categories of debt securities, each serving a different purpose for both the government and investors. The distinctions matter because maturity length, interest payment structure, and inflation protection all affect how these securities behave in different market environments.
Treasury Bills (T-Bills)
T-bills are short-term securities with maturities of 4, 8, 13, 17, 26, or 52 weeks. They don’t pay periodic interest. Instead, they’re sold at a discount to face value and mature at par — the difference is your return. For example, you might buy a $1,000 T-bill for $975 and receive $1,000 at maturity. T-bills are commonly used as a cash equivalent by institutional investors and as a benchmark for short-term interest rates. The 3-month T-bill rate is one of the most-watched indicators of where the Federal Reserve has set monetary policy.
Treasury Notes (T-Notes)
T-notes have maturities of 2, 3, 5, 7, or 10 years and pay interest every six months at a fixed rate (the “coupon”). The 10-year Treasury note is arguably the most important security in global finance. Its yield serves as the reference rate for 30-year fixed mortgage rates, corporate bond pricing, and is widely used as a gauge of economic growth expectations. When investors say “the 10-year is rising,” they’re describing an increase in this note’s yield, which typically signals expectations for stronger growth or higher inflation.
Treasury Bonds (T-Bonds)
T-bonds have maturities of 20 or 30 years and, like T-notes, pay semiannual interest. Because of their long duration, T-bonds are the most sensitive to interest rate changes — a small move in rates produces a large change in price. The 30-year bond is closely watched as a measure of long-term inflation expectations. Pension funds and insurance companies are major buyers of T-bonds because they need long-duration assets to match their long-term liabilities.
Treasury Inflation-Protected Securities (TIPS)
TIPS are unique because their principal value adjusts with the Consumer Price Index. If inflation rises 3% over a year, the principal on a TIPS bond increases by 3%, and your interest payment (calculated on the adjusted principal) rises accordingly. TIPS come in 5, 10, and 30-year maturities. The difference between a regular Treasury yield and a TIPS yield of the same maturity is called the “breakeven inflation rate” — it tells you what the bond market expects inflation to average over that period.
Floating Rate Notes (FRNs)
FRNs are 2-year securities with interest payments that adjust weekly based on the most recent 13-week T-bill auction rate. They offer protection against rising short-term rates because the coupon resets, unlike fixed-rate notes where you’re locked in. FRNs were introduced in 2014 and have become popular with money market funds and corporate treasurers managing short-term cash.
How the Treasury Auction Process Works
The Treasury sells new securities through a regular auction schedule — T-bills are auctioned weekly, while notes and bonds follow monthly or quarterly cycles. There are two types of bidders in every auction:
Competitive bidders specify the yield they’re willing to accept. These are typically large institutional investors — primary dealers (the ~24 major banks required to participate), hedge funds, foreign central banks, and pension funds. If their bid yield is too high (above the clearing rate), they don’t get any securities.
Non-competitive bidders agree to accept whatever yield the auction determines. Individual investors and smaller institutions typically bid non-competitively through TreasuryDirect.gov, guaranteeing they’ll receive securities but at the market-clearing rate.
Auction results are closely watched by markets. A “strong” auction — one with high demand, measured by the bid-to-cover ratio — can push yields lower across the curve. A “weak” auction with tepid demand can spike yields and rattle equity markets, as it suggests investors are demanding more compensation to hold U.S. debt.
Key Treasury Yields to Watch
Not all Treasury yields carry equal weight in financial markets. Here are the maturities that matter most and what each one signals:
The 2-Year Treasury Yield
The 2-year yield is the market’s best real-time estimate of where the Federal Reserve will set interest rates over the next two years. It moves ahead of Fed decisions — when traders expect rate cuts, the 2-year yield falls before the Fed actually cuts. It’s the most sensitive Treasury to monetary policy expectations and often moves sharply on inflation data, jobs reports, and Fed speeches.
The 10-Year Treasury Yield
The 10-year is the benchmark yield for the entire financial system. It directly influences 30-year mortgage rates, auto loan rates, corporate borrowing costs, and stock valuations (through discounted cash flow models). The 10-year yield reflects a combination of expected growth, expected inflation, and a “term premium” — the extra compensation investors demand for locking up money for a decade instead of rolling over short-term bills.
The 30-Year Treasury Yield
The 30-year yield is the market’s longest-term view on inflation and growth. It tends to move more slowly than shorter maturities because it incorporates decades of expectations. Large moves in the 30-year often signal fundamental shifts in how markets view long-term fiscal policy, inflation trajectories, or structural economic changes.
The 2s/10s Spread
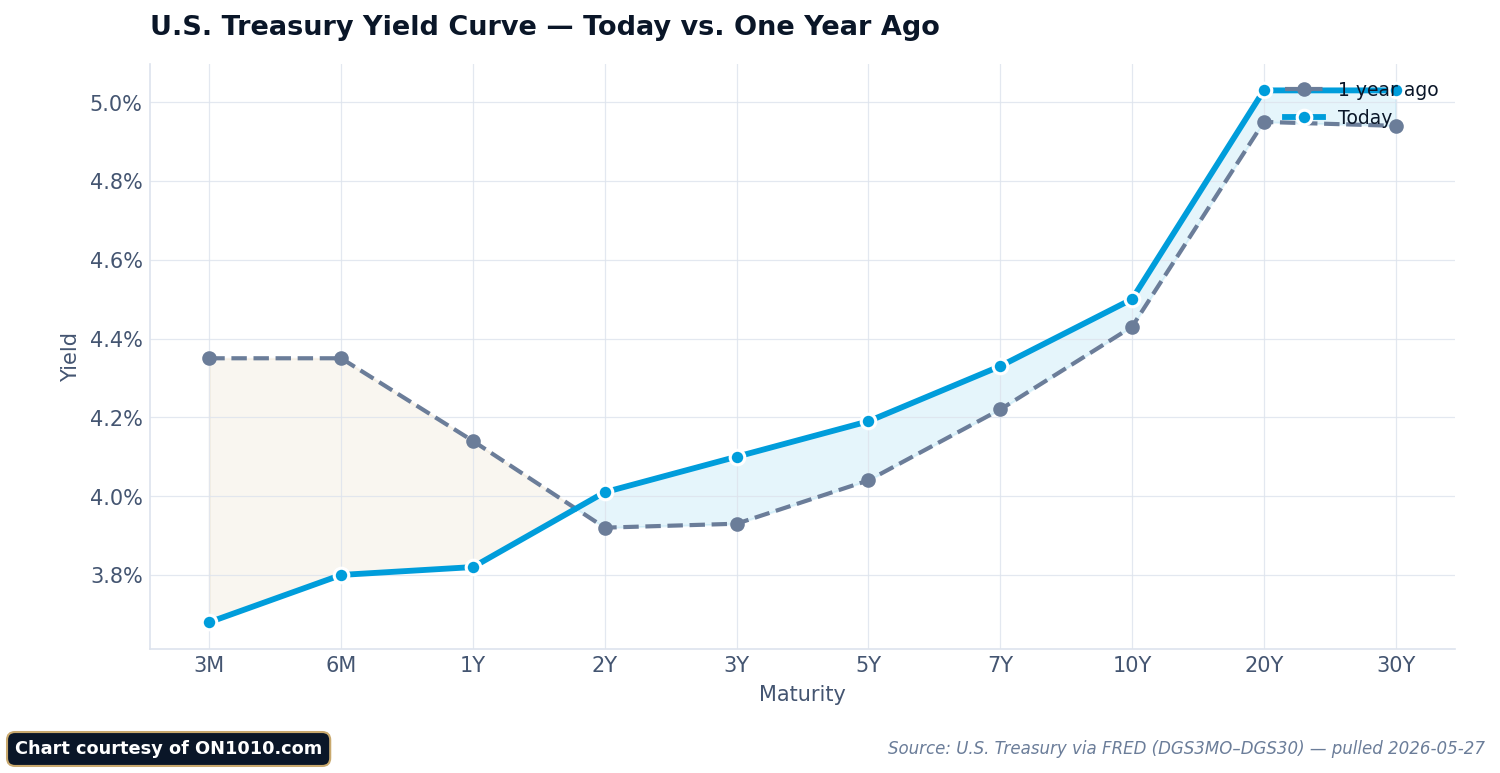
The difference between the 10-year and 2-year yields — known as the “2s/10s spread” — is one of the most reliable recession indicators in economics. Normally, longer-term yields are higher than shorter-term ones (a “positive” or “normal” curve). When the 2-year yield exceeds the 10-year (an “inversion”), it has historically preceded every U.S. recession since 1970 — though the lag time varies from 6 to 24 months. See our Yield Curve Explained guide for a deeper analysis.
How Treasury Yields Affect Other Markets
Treasury yields don’t exist in a vacuum. They ripple through virtually every corner of financial markets:
Mortgage Rates
The 30-year fixed mortgage rate closely tracks the 10-year Treasury yield, typically running about 1.5 to 2 percentage points higher (the “spread” compensates lenders for prepayment and credit risk). When the 10-year yield rises from 4% to 5%, mortgage rates tend to follow, directly affecting housing affordability, home prices, and construction activity.
Stock Valuations
Higher Treasury yields reduce stock valuations through two mechanisms. First, they increase the “discount rate” used in valuation models, making future corporate earnings worth less in today’s dollars. Second, they make bonds a more attractive alternative to stocks — why take equity risk when you can earn 5% risk-free? Growth stocks and technology companies are especially sensitive to rising yields because their valuations depend heavily on distant future earnings.
Corporate Bond Markets
Corporate bonds are priced as a spread above Treasury yields. A company might issue bonds at “Treasuries plus 150 basis points.” When the underlying Treasury yield rises, the company’s borrowing cost rises too, which can affect capital investment decisions, stock buybacks, and ultimately earnings. Credit spreads — the gap between corporate and Treasury yields — also widen during times of economic stress, compounding the impact.
The U.S. Dollar
Higher Treasury yields attract foreign capital seeking better returns, which increases demand for dollars and strengthens the currency. A stronger dollar makes U.S. exports more expensive abroad and can pressure the earnings of multinational companies. It also creates headwinds for emerging market economies that borrow in dollars.
What Drives Treasury Yield Movements
Treasury yields respond to a complex set of forces. Understanding these drivers helps you interpret yield movements rather than just reacting to them:
Federal Reserve policy is the dominant short-term driver. The fed funds rate sets the floor for short-term yields, and forward guidance about future rate moves can shift the entire curve. Rate hikes push yields up; rate cuts push them down.
Inflation data moves yields because inflation erodes the purchasing power of fixed-income payments. Higher-than-expected CPI or PCE readings typically push yields higher as investors demand more compensation. Lower inflation readings have the opposite effect.
Economic growth expectations affect yields because stronger growth tends to produce higher inflation and greater demand for capital (borrowing). GDP reports, jobs data, and manufacturing surveys all influence growth expectations and, by extension, yields.
Flight to safety can override all other factors. During financial crises, geopolitical shocks, or market panics, investors rush into Treasuries as a safe haven, driving yields sharply lower regardless of economic fundamentals. This is why yields fell during COVID-19 even as the government was issuing unprecedented amounts of new debt.
Supply and demand dynamics matter more than many investors realize. When the Treasury issues large amounts of new debt (especially at longer maturities), yields can rise simply because the market needs to absorb more supply. The Federal Reserve’s quantitative tightening program — allowing bonds to mature without reinvesting — adds to the supply that private markets must absorb.
How to Read Treasury Market Signals
Putting it all together, here are the practical signals to watch:
Falling yields across the curve typically signal economic slowdown fears, expectations for Fed rate cuts, or a flight to safety. This is generally negative for bank stocks (which earn less on loans) but positive for bond prices and often for growth stocks.
Rising yields across the curve suggest expectations for stronger growth, higher inflation, or both. This is generally positive for bank stocks and financial companies but creates headwinds for highly valued growth stocks and the housing market.
A flattening yield curve (short-term yields rising faster than long-term ones) often signals that the Fed is tightening policy and the market expects that tightening to eventually slow the economy. It’s a caution signal.
A steepening yield curve (long-term yields rising faster than short-term ones) can mean the market expects stronger growth ahead, or it can reflect concerns about long-term fiscal sustainability and inflation. Context matters.
Frequently Asked Questions
What makes Treasury securities “risk-free”?
Treasuries are considered risk-free because they’re backed by the full faith and credit of the U.S. government, which has the power to tax and print currency. While no investment is truly without risk — inflation can erode purchasing power, and prices fluctuate with interest rates — the credit risk (the chance of not getting your money back) is essentially zero. The U.S. has never defaulted on its debt obligations.
How do I buy Treasury securities?
Individual investors can buy Treasuries directly through TreasuryDirect.gov with no fees or commissions. You can also buy them through a brokerage account. For most investors, Treasury ETFs (like those tracking short-term, intermediate, or long-term Treasuries) offer easier access with daily liquidity and no need to manage individual maturities.
Why do Treasury yields matter if I only own stocks?
Treasury yields affect stock valuations directly. Higher yields increase the discount rate used to value future corporate earnings, which reduces the present value of stocks — particularly growth and technology stocks with earnings far in the future. Rising yields also make bonds a more competitive alternative to equities, which can draw capital out of the stock market.
What is the term premium and why does it matter?
The term premium is the extra yield investors demand for holding longer-maturity bonds instead of rolling over short-term bills. It compensates for interest rate risk and uncertainty. When the term premium is low or negative, it means investors are so eager for the safety of long-term bonds that they’re willing to accept very little extra compensation — often a sign of economic anxiety.
How does quantitative tightening affect Treasury yields?
Quantitative tightening (QT) is when the Federal Reserve lets its Treasury holdings mature without reinvesting the proceeds. This increases the supply of Treasuries that private markets must absorb, which can push yields higher. The Fed accumulated roughly $5 trillion in Treasuries during its quantitative easing programs; as that unwinds, it puts upward pressure on yields independent of economic fundamentals.
What is the relationship between Treasury yields and the federal funds rate?
The federal funds rate is the overnight lending rate set by the Fed. It directly anchors the shortest-term Treasury yields (T-bills). Longer-term yields incorporate the fed funds rate plus expectations about future rate changes, inflation, and the term premium. When the Fed signals rate cuts, the 2-year yield often drops before the actual cut, while the 10-year may move less if the cuts are already priced in.
Stay Ahead of the Data
Get free daily economic analysis delivered to your inbox. Our AI-powered briefings break down the data that moves markets — in plain English.