
The Yield Curve Is Telling Us Something Different Than You Think
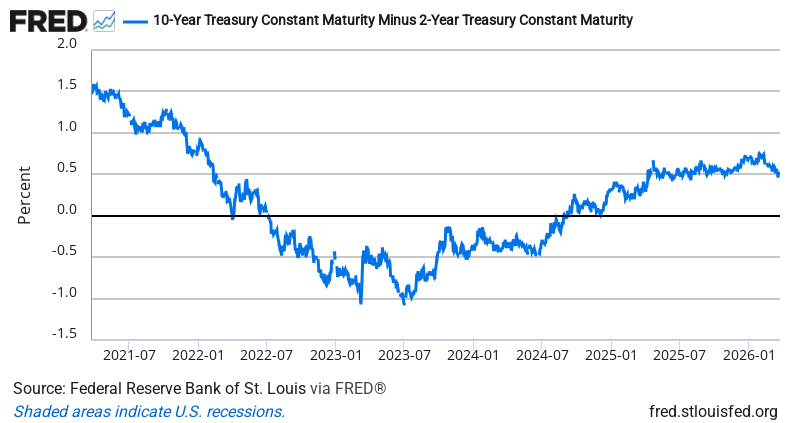
The 10-year/2-year Treasury spread ticked down to 0.49% yesterday from 0.51% the day before. That 0.02 percentage point drop might look trivial, but it’s part of a pattern that reveals something important about where we are in this economic cycle.
Everyone fixates on whether the yield curve inverts (goes negative) because that’s historically predicted recessions. But the curve has been positive and relatively stable around 0.50% for the past week, bouncing between 0.46% and 0.52%. This isn’t the behavior you’d expect if recession fears were building or if inflation expectations were spiraling.
Instead, this looks like a curve that’s found equilibrium. The 10-year yield is pricing in steady long-term growth while the 2-year reflects where Fed policy is likely headed. That 0.49% spread suggests investors see the economy in a Goldilocks zone: growing enough to keep long-term rates elevated, but not so hot that the Fed needs to slam the brakes.
Here’s what’s really interesting: this spread is much wider than it was during the actual inversion periods of 2022-2023, when recession calls were loudest. Back then, the curve was deeply negative, sometimes by more than 1%. Now we’re in positive territory with low volatility. That’s typically what you see when the economy has found its footing.
The narrow daily moves (yesterday’s 0.02% decline was just a 3.9% change) also tell a story. When the curve is whipsawing around, it usually means bond traders are getting conflicting signals about growth and inflation. This stability suggests the economic picture is becoming clearer, not more confused.
Historically, investors have used curve steepening (when the spread widens) as a signal that growth expectations are improving and recession risks are fading. We’re not seeing dramatic steepening here, but we’re also not seeing the flattening that would suggest trouble ahead.
Bottom Line: A stable, positive yield curve around 0.50% isn’t screaming recession or inflation crisis. It’s whispering “steady as she goes.” Sometimes the most important market signal is the absence of panic.
Source: Federal Reserve Economic Data (FRED)
ON1010.com provides economic education for investors. Nothing here is investment advice. Always consult a qualified financial advisor before making investment decisions.
Free Research
The economy moves fast. We make sure you move faster.
Economic data, policy shifts, and market signals — delivered to your inbox.
Subscribe Free