
The Yield Curve Just Climbed to Its Steepest Point in Weeks. Here’s What That Tells Us.
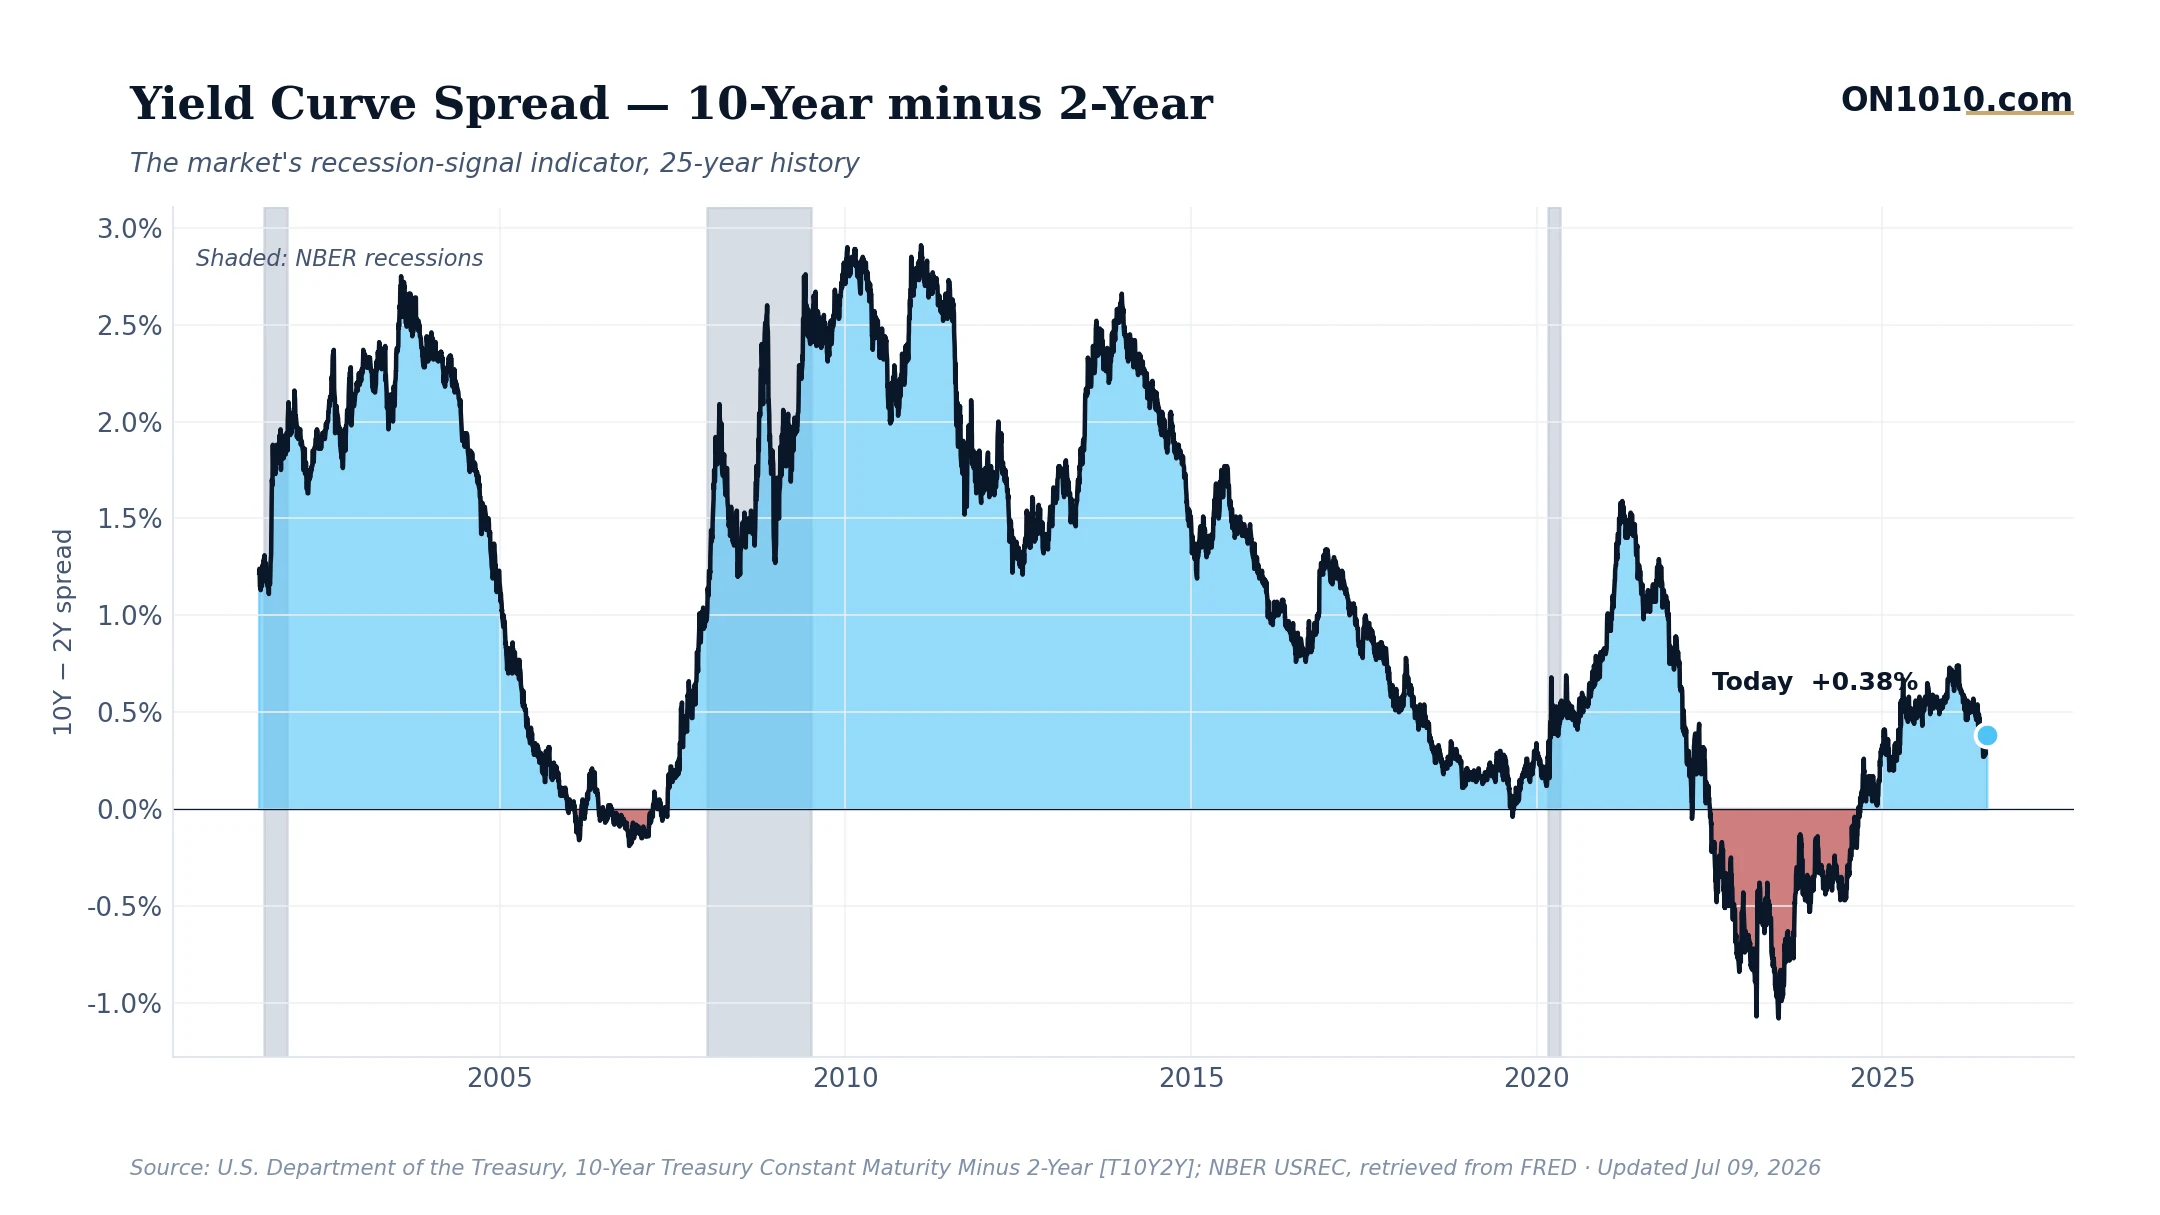
The gap between 10-year and 2-year Treasury yields widened to 0.38% on July 9, the steepest reading in the recent trend and up from 0.31% just eight days ago. That’s a small number in absolute terms, but the direction matters more than the level right now.
The Bigger Picture
A year ago, this spread was deeply inverted, meaning short-term rates sat above long-term rates. That’s historically been one of the most reliable recession signals in financial markets, with the 2000 and 2007 downturns both preceded by extended inversions. The curve has been slowly climbing back toward positive territory, and at 0.38%, it’s now been positive for several consecutive sessions. That shift from negative to positive is called “disinversion,” and it tends to mark a turning point in the credit cycle. Importantly, the broader market appears to be taking note: equities are trading above both their 50-day and 200-day moving averages, a classic bullish signal, even as some defensive sectors like Health Care are quietly outperforming.
Why It Matters
Historically, this type of shift has been a double-edged signal. When the curve disinverts because long-term rates rise relative to short-term rates, it often reflects markets pricing in better growth ahead. But in past cycles, the period just after disinversion has also coincided with actual economic slowdowns arriving. The mechanism is worth understanding: banks borrow short and lend long, so a steeper curve generally improves their lending margins, which can ease credit conditions for businesses and households over time. Capital allocators in past cycles have watched this closely as a signal about whether credit is loosening or tightening.
Bottom Line: The yield curve is healing, and that’s broadly constructive. But the more interesting question is why it’s steepening, and whether that reflects genuine growth optimism or something else shifting in the rate outlook.
Source: Federal Reserve Economic Data (FRED)
ON1010 Research is an independent publisher of economic education and is not a registered investment adviser, broker-dealer, or investment company. This content is for educational and informational purposes only and is not investment advice or a recommendation to buy, sell, or hold any security. Published under the publisher exemption recognized by Section 202(a)(11)(D) of the Investment Advisers Act of 1940 (Lowe v. SEC). Always consult a qualified financial professional before making any financial decision.
Free Research
The economy moves fast. We make sure you move faster.
Economic data, policy shifts, and market signals — delivered to your inbox.
Subscribe Free