
PCE Price Index: Latest Release
The Fed’s Inflation Gauge Is Stuck Above 3%. That’s the Whole Story.
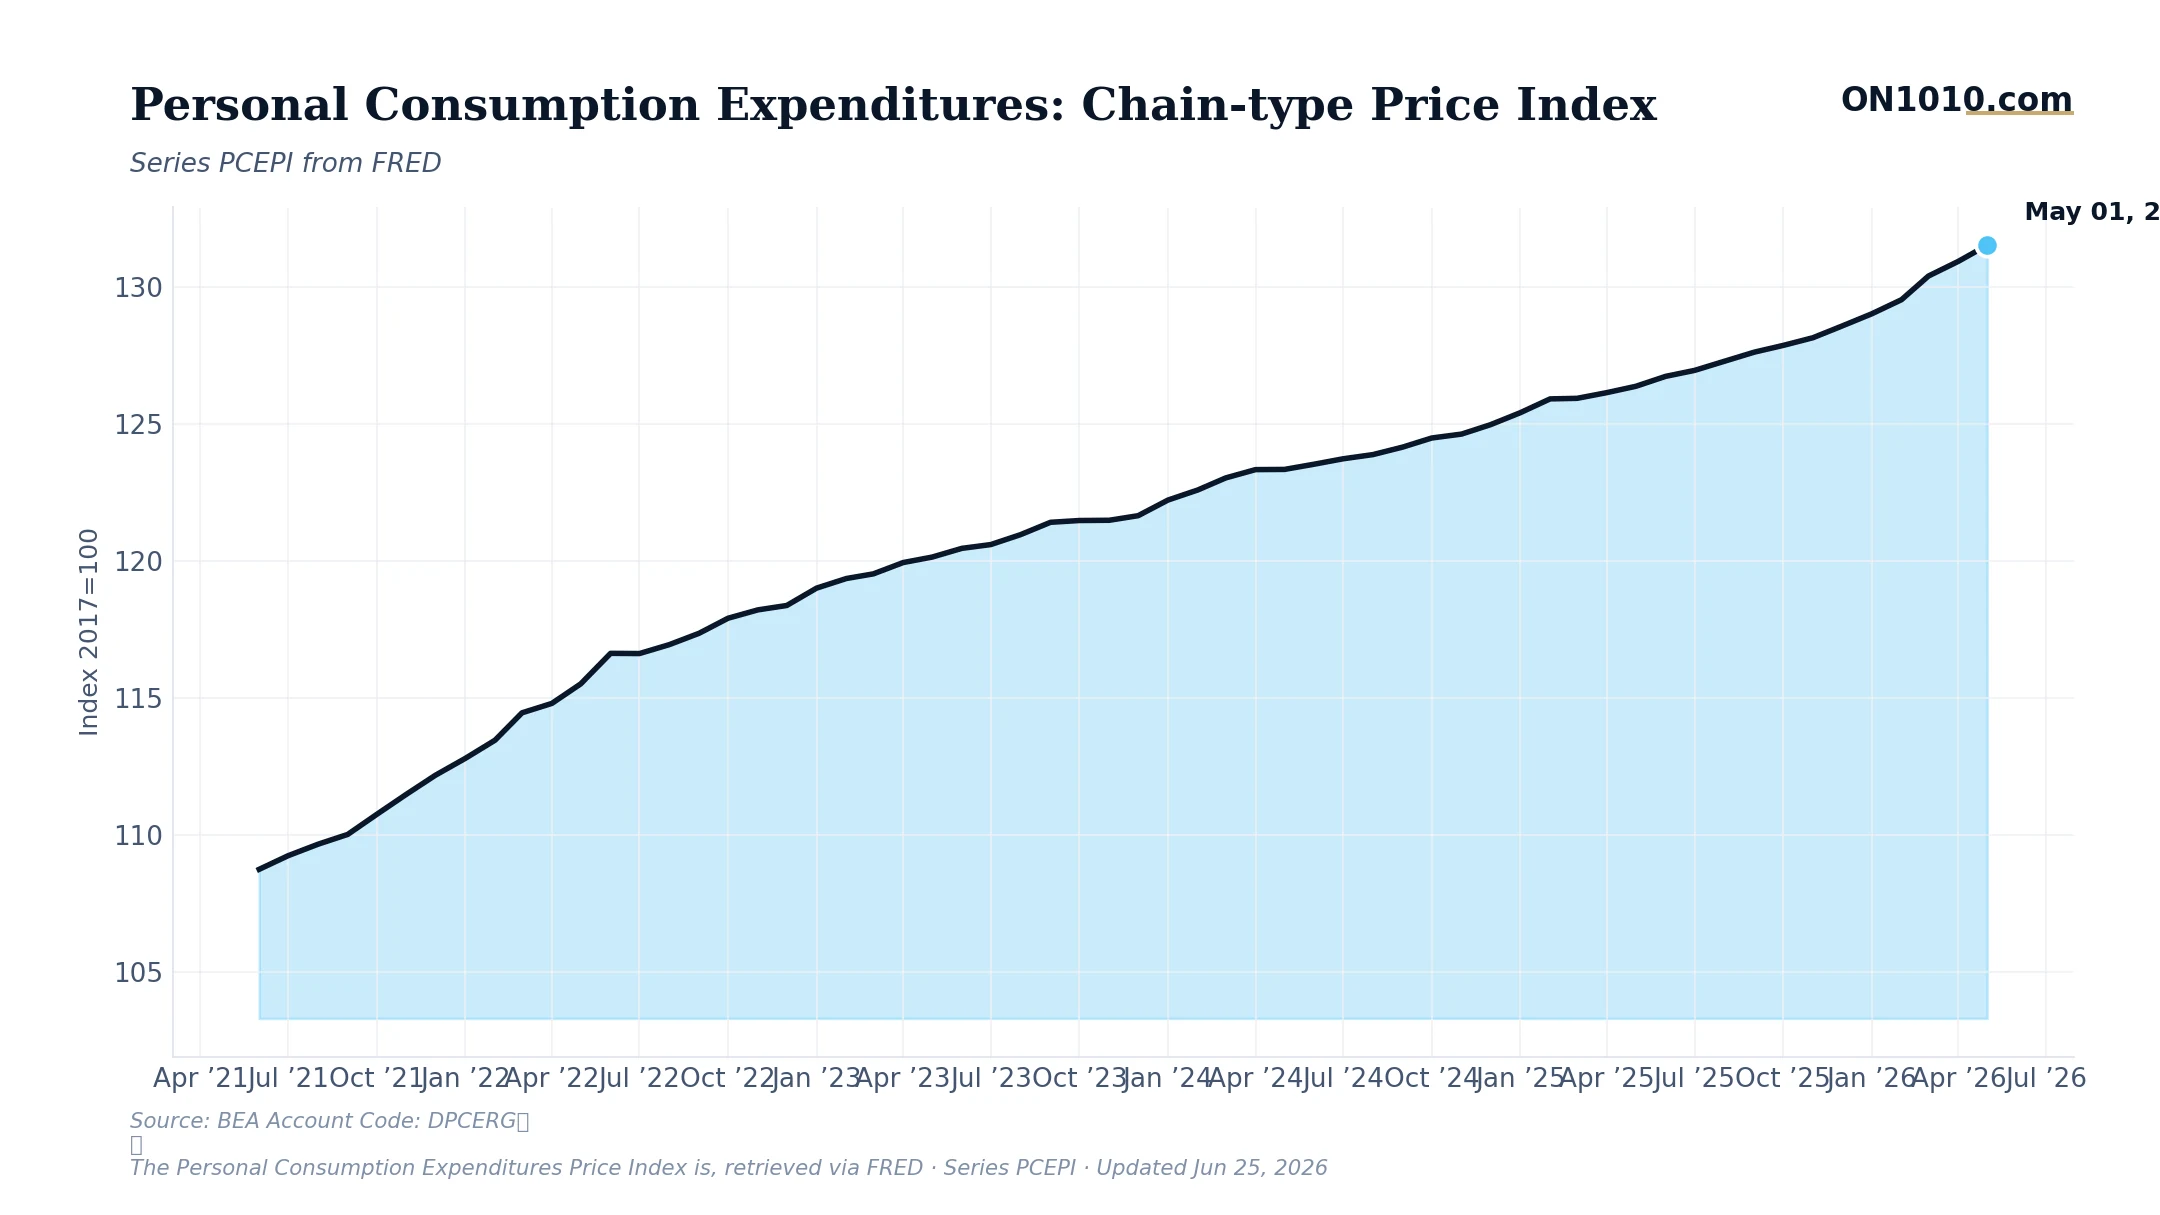
The PCE price index rose 0.45% in May, pushing the year-over-year rate to 3.6%. That’s not a disaster. But it’s also not close to the Fed’s 2% target, and it shows no real sign of getting there quickly.
Look at the trend and it tells a clean story: PCE has risen every single month since December, accelerating from 128.576 to 131.527 in six months. That’s not a one-month blip. That’s a pattern.
Here’s the bigger picture tension. The broader economy has some genuine bright spots right now: industrial and financial stocks are outperforming, equity markets are in a confirmed golden cross setup, and VIX sits in normal volatility territory at 18. Growth signals are real. But persistent inflation running nearly double the Fed’s target means the central bank still has its foot on the brake. Those two things can coexist for a while, but they create pressure. Strong growth plus stubborn inflation is exactly the setup that has historically kept rates higher for longer than markets expect.
That matters for anyone thinking about capital allocation or business planning. Historically, when PCE has held above 3% while the economy remained resilient, the Fed has shown little urgency to cut. Borrowing costs stay elevated. That affects the math on everything from acquisitions to real estate to the cost of carrying inventory. In past cycles, investors have paid close attention to whether month-over-month PCE was decelerating even if the year-over-year number remained elevated. Right now, the monthly trend is not decelerating. May’s 0.45% gain was the fastest monthly increase in this six-month window.
As always, what this means for your specific financial decisions belongs with a qualified professional who knows your situation.
Bottom Line: 3.6% PCE with a rising monthly trend is the Fed’s least favorite kind of report: not alarming enough to panic, but persistent enough to justify patience. The question is how long “higher for longer” runs before it starts to slow the growth story that’s otherwise holding up.
Source: Federal Reserve Economic Data (FRED)
ON1010 Research is an independent publisher of economic education and is not a registered investment adviser, broker-dealer, or investment company. This content is for educational and informational purposes only and is not investment advice or a recommendation to buy, sell, or hold any security. Published under the publisher exemption recognized by Section 202(a)(11)(D) of the Investment Advisers Act of 1940 (Lowe v. SEC). Always consult a qualified financial professional before making any financial decision.
Free Research
The economy moves fast. We make sure you move faster.
Economic data, policy shifts, and market signals — delivered to your inbox.
Subscribe Free