
ON1010 Research Guide
Economic Calendar Guide
The data releases that move markets — what they measure, when they drop, and why they matter.
The U.S. economic calendar is a schedule of government data releases, Federal Reserve announcements, and other reports that provide insight into the health of the economy. For investors, these releases are the raw material that drives market movements — stocks, bonds, currencies, and commodities all react to incoming data. Knowing what’s on the calendar, what each report measures, and how markets typically respond is essential for staying ahead of volatility rather than reacting to it.
Key concept: Markets don’t just react to whether data is “good” or “bad” — they react to whether data is better or worse than expected. The “consensus estimate” (the average forecast from economists surveyed by major outlets) sets the bar. A strong jobs report that comes in below expectations can still cause stocks to fall. Always compare releases to consensus, not to prior readings alone.
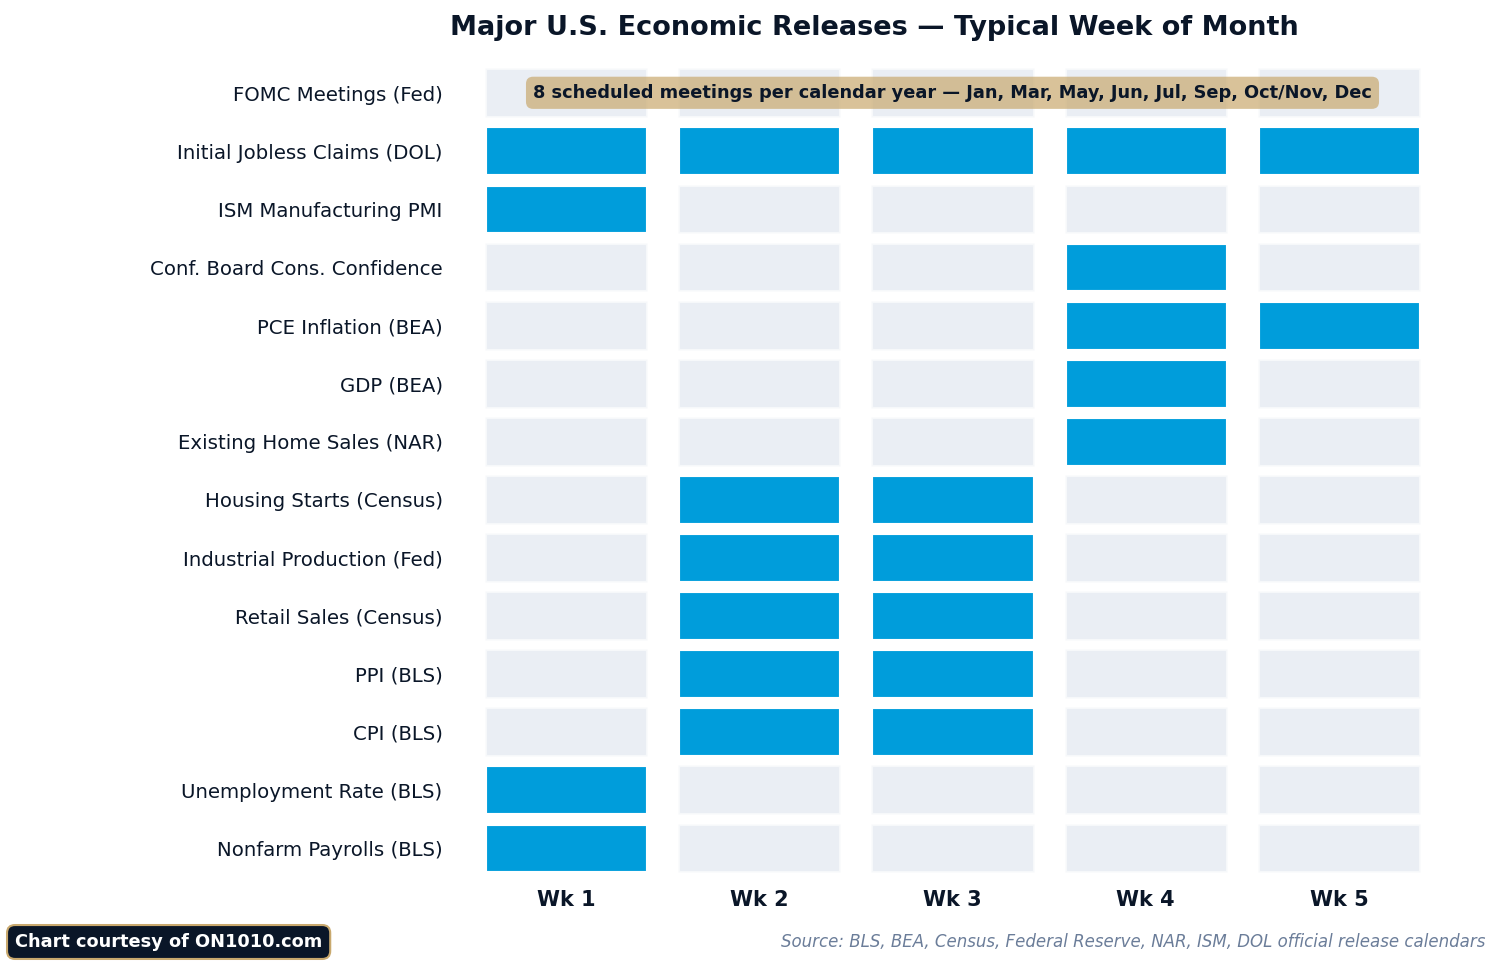
Tier 1: Market-Moving Releases
These are the reports that consistently produce the largest market reactions. When these numbers drop, trading volume spikes and prices can move sharply within minutes.
Employment Situation Report (Jobs Report)
Source: Bureau of Labor Statistics (BLS)
Frequency: Monthly (first Friday of the month, 8:30 AM ET)
Key metrics: Nonfarm payrolls, unemployment rate, average hourly earnings, labor force participation rate
The jobs report is arguably the single most important economic release each month. Nonfarm payrolls tell you how many jobs the economy added or lost, while average hourly earnings signal wage inflation pressure. The unemployment rate gets the headlines, but traders focus more on payrolls and wages because those numbers drive Fed policy expectations. A hot jobs report (strong payrolls + rising wages) pushes bond yields higher and can weigh on stocks as investors price in tighter monetary policy. See our full Jobs Report Explained guide for a deeper breakdown.
Consumer Price Index (CPI)
Source: Bureau of Labor Statistics
Frequency: Monthly (typically the second or third week, 8:30 AM ET)
Key metrics: Headline CPI (all items), core CPI (excluding food and energy), month-over-month and year-over-year changes
CPI is the primary inflation gauge that markets watch. Core CPI strips out volatile food and energy prices to show the underlying inflation trend. The Fed doesn’t officially target CPI (it prefers PCE), but CPI gets far more market attention because it’s released earlier and moves markets more dramatically. A higher-than-expected CPI reading typically sends bond yields up and stocks down, as it suggests the Fed will need to keep rates higher for longer. See our CPI Explained guide.
Federal Reserve Interest Rate Decisions (FOMC)
Source: Federal Open Market Committee
Frequency: 8 scheduled meetings per year (roughly every 6 weeks), with the statement released at 2:00 PM ET followed by the chair’s press conference at 2:30 PM ET
Key outputs: Federal funds rate target, policy statement language, dot plot (quarterly), Summary of Economic Projections (quarterly)
FOMC days are the highest-volatility events on the calendar. The rate decision itself is often priced in ahead of time (futures markets assign probabilities), so the real market-moving content comes from the statement language (hawkish vs. dovish shifts), the dot plot (each Fed official’s rate forecast), and the press conference (where the chair can signal future intentions). A single word change in the statement — like adding “patient” or removing “transitory” — can trigger massive moves.
Gross Domestic Product (GDP)
Source: Bureau of Economic Analysis (BEA)
Frequency: Quarterly, with three releases: advance (1 month after quarter ends), second estimate, and third estimate
Key metrics: Real GDP growth rate (annualized), personal consumption, business investment, government spending, net exports
GDP is the broadest measure of economic activity. The advance estimate generates the most market reaction because it’s the first look at the quarter’s growth. However, GDP is backward-looking by nature — by the time the data is released, the quarter is already over. Markets use GDP to confirm or challenge their existing growth narrative rather than to discover new information. A GDP surprise (much stronger or weaker than expected) can still move markets significantly, particularly if it shifts the Fed policy outlook. See our GDP Explained guide.
Personal Consumption Expenditures (PCE) Price Index
Source: Bureau of Economic Analysis
Frequency: Monthly (typically the last week of the month, 8:30 AM ET)
Key metrics: Headline PCE, core PCE (excluding food and energy), personal income, personal spending
Core PCE is the Federal Reserve’s preferred inflation measure — it’s what the 2% inflation target officially refers to. PCE uses a broader basket of goods and services than CPI and accounts for substitution effects (when consumers switch to cheaper alternatives). While CPI gets more day-to-day attention, PCE is what the Fed actually bases its policy decisions on. The monthly release also includes personal income and spending data, giving a comprehensive view of the consumer economy.
Tier 2: Important but Less Volatile
These releases provide valuable economic context and can move markets, but typically produce smaller reactions than Tier 1 data.
ISM Manufacturing and Services PMIs
Source: Institute for Supply Management
Frequency: Monthly (manufacturing on the first business day, services on the third business day)
Key metrics: Headline PMI, new orders, employment, prices paid, production
PMI (Purchasing Managers’ Index) surveys ask business executives whether conditions are expanding or contracting. A reading above 50 signals expansion; below 50 signals contraction. The ISM manufacturing PMI is one of the oldest and most respected leading indicators. The new orders component is especially forward-looking — a decline in new orders often precedes broader economic weakness by several months. The prices paid component also matters because it signals pipeline inflation pressure.
Retail Sales
Source: Census Bureau
Frequency: Monthly (mid-month, 8:30 AM ET)
Key metrics: Total retail sales, retail sales excluding autos, “control group” (excludes autos, gas, building materials, and food services)
Consumer spending makes up roughly 70% of U.S. GDP, making retail sales a critical health check on the economy’s largest engine. The “control group” reading feeds directly into the GDP calculation for personal consumption. Strong retail sales suggest a resilient consumer; weak sales can signal that households are pulling back — often a precursor to broader economic weakness.
Producer Price Index (PPI)
Source: Bureau of Labor Statistics
Frequency: Monthly (typically the week before CPI)
Key metrics: Final demand PPI, core PPI (excluding food, energy, and trade services)
PPI measures inflation at the wholesale level — what producers are paying for inputs before those costs get passed to consumers. Rising PPI can foreshadow CPI increases because businesses eventually pass higher costs to customers. Traders often use PPI as a preview of the upcoming CPI report, since several PPI components feed directly into the PCE calculation.
Housing Data
Sources: Census Bureau, National Association of Realtors, S&P CoreLogic Case-Shiller
Key releases: Housing starts and permits (monthly), existing home sales (monthly), new home sales (monthly), Case-Shiller home price index (monthly, 2-month lag)
Housing is both an economic indicator and a financial market in its own right. Building permits are a leading indicator because they reflect developers’ expectations about future demand. Existing home sales show current activity levels. The Case-Shiller index tracks home price trends. Since housing is the most interest-rate-sensitive sector of the economy, these reports are particularly useful for gauging the real-world impact of Fed rate changes.
Consumer Confidence and Sentiment
Sources: Conference Board (Consumer Confidence Index), University of Michigan (Consumer Sentiment Index)
Frequency: Monthly (Conference Board on the last Tuesday, Michigan preliminary mid-month and final end-of-month)
These surveys measure how consumers feel about current and future economic conditions. The expectations component of both surveys has some value as a leading indicator, though the relationship between sentiment and actual spending behavior is looser than you might expect. Markets pay more attention when sentiment diverges sharply from hard data — for example, when consumers report feeling pessimistic even as spending remains strong.
Tier 3: Supporting Data
These releases round out the economic picture. They rarely move markets on their own but provide context that helps interpret Tier 1 and Tier 2 data.
Initial and Continuing Jobless Claims
Source: Department of Labor
Frequency: Weekly (Thursdays, 8:30 AM ET)
Key metrics: Initial claims (new filings), continuing claims (ongoing benefits), 4-week moving average
Weekly jobless claims are the most timely labor market indicator available. Initial claims below ~250,000 generally signal a healthy labor market. A sustained rise above 300,000 would suggest meaningful deterioration. The 4-week moving average smooths out volatility and provides a clearer trend. Claims data often signals turning points in the labor market weeks before it shows up in the monthly jobs report.
Durable Goods Orders
Source: Census Bureau
Frequency: Monthly (about 4 weeks after the reference month)
Key metrics: Total durable goods orders, excluding transportation (strips out volatile aircraft orders), core capital goods orders (business investment proxy)
Core capital goods orders (nondefense, excluding aircraft) are the best real-time indicator of business investment intentions. When companies order expensive equipment, it signals confidence in future demand. A sustained decline in core capital goods orders can foreshadow a broader investment slowdown and weaker GDP growth.
Industrial Production and Capacity Utilization
Source: Federal Reserve
Frequency: Monthly
Key metrics: Industrial production index, manufacturing output, capacity utilization rate
These reports measure the output of factories, mines, and utilities. Capacity utilization — the percentage of productive capacity in use — is a useful inflation signal. High capacity utilization (above ~80%) suggests supply constraints that can lead to price increases. Low utilization signals slack in the economy and reduced inflation pressure.
Trade Balance
Source: Census Bureau and BEA
Frequency: Monthly
Key metrics: Trade deficit (exports minus imports), bilateral trade balances
The trade balance directly affects GDP (net exports are a component) and influences currency markets. A widening trade deficit can reflect strong domestic demand (importing more) or weakening export competitiveness. Trade data has become increasingly market-sensitive during periods of trade policy uncertainty, tariff negotiations, and geopolitical tension.
How to Use the Economic Calendar
Knowing the calendar is only useful if you know how to act on it. Here are practical tips:
Check the calendar weekly. At the start of each week, identify which major releases are coming. This helps you anticipate potential volatility rather than being surprised by it. ON1010’s daily briefings flag upcoming releases so you don’t have to track the calendar yourself.
Focus on the consensus estimate. Before a release, know what economists expect. The number itself matters less than how it compares to expectations. Resources like Trading Economics and Bloomberg publish consensus forecasts.
Watch for revisions. Many economic reports are revised in subsequent months. A strong initial reading that gets revised downward tells a different story than the headline suggests. GDP and jobs data are particularly revision-prone.
Look at the internals, not just the headline. A strong headline jobs number with declining full-time employment and falling average hours tells a more nuanced story than the top-line figure alone. The details often matter more than the summary.
Understand seasonal adjustments. Most economic data is seasonally adjusted to account for predictable patterns (holiday hiring, construction seasonality). Occasionally, unusual weather or one-time events can distort the seasonal adjustment, making the data look better or worse than underlying conditions warrant.
Frequently Asked Questions
When do most economic releases come out?
Most U.S. economic data is released at 8:30 AM Eastern Time, before the stock market opens at 9:30 AM. This gives markets 60 minutes to digest the data before the opening bell. FOMC decisions are the major exception — they come at 2:00 PM ET while markets are open, which is why FOMC days often see the biggest intraday swings.
Which release moves markets the most?
On average, the monthly CPI report and FOMC rate decisions produce the largest immediate market reactions, followed by the jobs report. However, any release can be a major mover if it delivers a large enough surprise relative to expectations.
Where can I find the economic calendar?
Free economic calendars are available from Trading Economics, Investing.com, MarketWatch, and the Federal Reserve Bank of New York. ON1010 covers the most important releases in our daily briefings with analysis of what the data means for markets and investors.
Do I need to trade around every data release?
No — and most investors shouldn’t try. Short-term trading around data releases requires speed and expertise that most retail investors don’t have (and institutional traders have algorithms for). For most investors, the economic calendar is better used as a context tool: understanding the data helps you make sense of market moves and make better long-term allocation decisions. You don’t need to act on every number, but you should understand what the numbers mean.
Stay Ahead of the Data
Get free daily economic analysis delivered to your inbox. Our AI-powered briefings break down the data that moves markets — in plain English.