
ON1010 RESEARCH GUIDE
GDP Explained: Understanding Economic Growth
How economic output is measured, what drives growth, and why GDP matters for markets, policy, and your financial decisions.
GDP measures the total value of all goods and services a country produces in a specific time period, making it the single most comprehensive scorecard for economic activity. When GDP rises, it typically signals more jobs, higher incomes, and expanding business opportunities. When it falls, layoffs and recessions often follow.
This article breaks down how GDP gets calculated, what drives it higher or lower, and why the number you see in headlines might not tell the whole story. You’ll learn the difference between real and nominal growth, discover what GDP leaves out entirely, and understand how investors and policymakers use this data to make decisions that ripple through markets and your daily life.
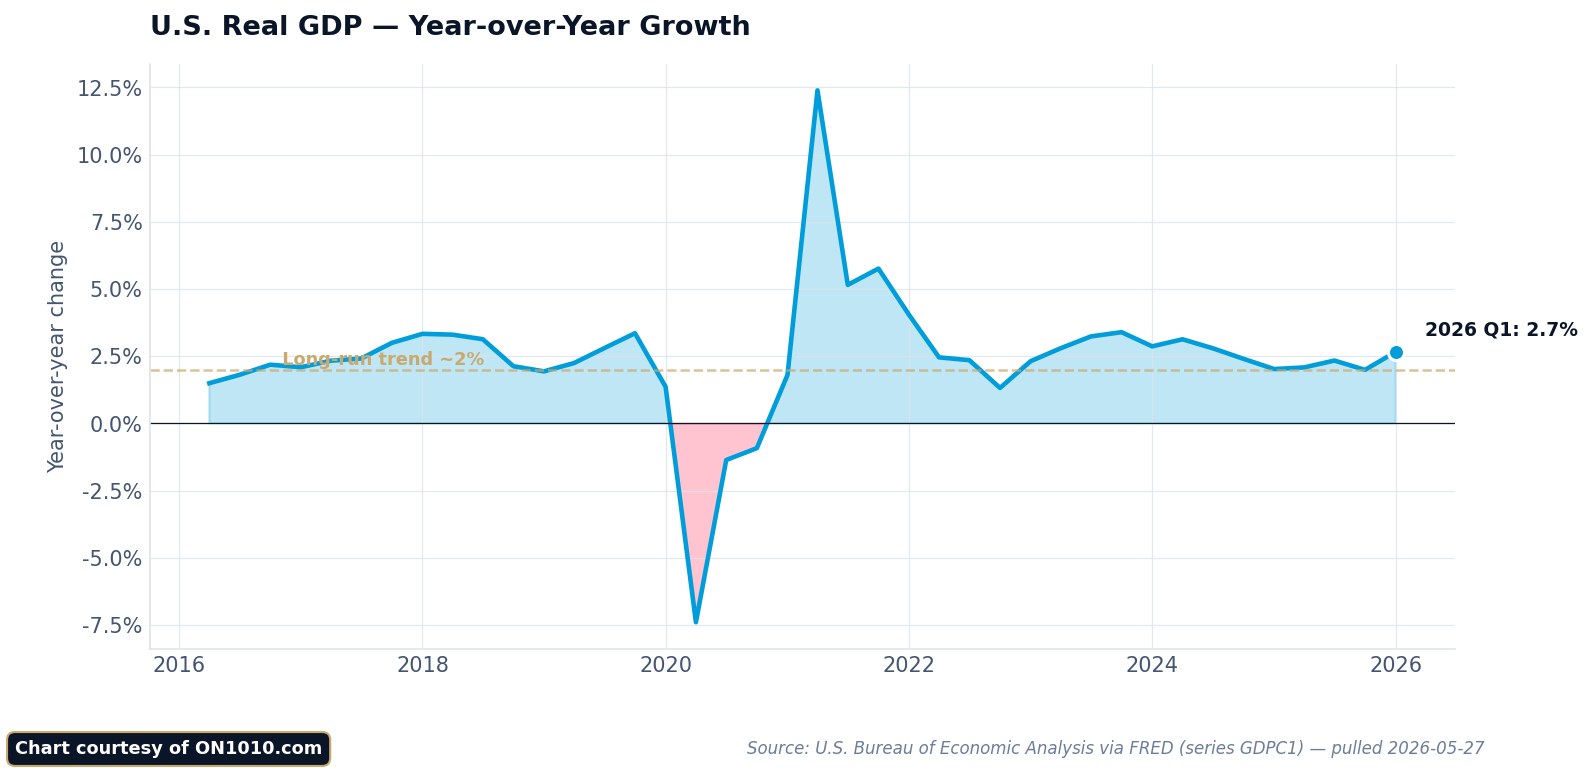
GDP Explained: What It Really Measures and Why It Matters
Gross domestic product tracks the total value of everything your country produces over a specific time period. It serves as the primary scorecard for measuring economic size and health, though it tells you more about production activity than actual prosperity.
Defining Gross Domestic Product
GDP measures the market value of all finished goods and services produced within a country’s borders during a set period. Think of it as adding up every car, haircut, software program, and medical procedure created in a quarter or year.
The calculation focuses on final products only. If a steel mill sells metal to a car company, GDP counts the finished car’s value, not the steel component separately. This prevents double counting the same economic activity.
What is gross domestic product really tracking? It captures four main categories: what you and other consumers spend, what businesses invest in equipment and buildings, what government purchases, and the net difference between exports and imports.
The number you typically see reported is the percentage change from the previous period. A 2.5% GDP growth rate means the economy produced 2.5% more than the prior quarter or year.
The Role of GDP as an Economic Indicator
Why GDP matters becomes clear when you look at who uses it. The Federal Reserve adjusts interest rates based on GDP trends. Congress and the White House shape spending and tax policy around these numbers. Business leaders make hiring and expansion decisions by watching GDP patterns.
The Bureau of Economic Analysis releases three estimates for each quarter: an advance estimate about a month after the quarter ends, then second and third estimates as more complete data arrives. This revision process matters because early numbers can shift significantly.
GDP data gets adjusted for seasonal patterns like holiday shopping or factory schedules. Without these adjustments, you might mistake regular yearly cycles for actual economic shifts. The numbers also come in two forms: nominal GDP uses current prices, while real GDP removes inflation effects so you can compare different time periods accurately.
Capital flows toward growing economies. When GDP accelerates, it signals that businesses see profitable opportunities worth investing in.
GDP vs National Wealth and Well-Being
GDP tracks production flow, not accumulated wealth or quality of life. A country could show strong GDP growth while its citizens face declining living standards or environmental degradation.
The measurement misses unpaid work like caregiving or volunteer activities. It counts government spending at cost rather than value delivered. A billion dollars spent on healthcare administration adds the same to GDP as a billion spent on actual medical care.
GDP also ignores how income gets distributed across your population. Two countries with identical per capita GDP might offer vastly different experiences: one with broad prosperity, another with extreme inequality. The metric treats resource depletion as income rather than drawing down capital.
These limitations don’t make GDP useless. They mean you need additional indicators to understand economic health fully. GDP excels at measuring production capacity and short-term economic momentum. It just doesn’t tell you whether that production improves lives or builds lasting prosperity.
How GDP Is Calculated: The Building Blocks
Economists use three distinct methods to measure the same thing: the total value of what an economy produces. Each approach counts different pieces of the economic puzzle, but they should all arrive at the same number if the math works out.
Expenditure, Output, and Income Approaches
The expenditure method tracks where money gets spent across four main categories. You add up what households buy (consumption), what businesses invest in equipment and buildings (investment), what governments spend on services and infrastructure (government spending), and the difference between exports and imports (net exports). This formula looks like: GDP = C + I + G + (X – M).
The output method, also called the production approach, adds up the value each industry creates. Think of it as following products through the economy and counting only what each step adds to the final price.
The income method flips the perspective entirely. It counts all the money people earn: wages from jobs, profits from businesses, and taxes the government collects minus subsidies it pays out. When a dollar gets spent in the expenditure approach, someone else earns that same dollar in the income approach.
Final Goods and Value Added
GDP only counts final goods and services, not the intermediate steps along the way. If steel gets sold to a car maker, you don’t count the steel separately. You only count the finished car’s price.
This is where value added becomes crucial. A taxi driver charges $10 for a ride but spends $3 on gas and insurance. Her value added is $7: the difference between what she charges and what she pays for inputs. When you add up everyone’s value added across the entire economy, you get GDP without double counting.
Some production never shows up in markets but still counts. If you grow vegetables in your garden for your own table, that technically adds to GDP. But if you clean your own house or cook your own dinner, those don’t count because they’re personal services, not goods.
GDP Formula in Practice
The production method starts with basic prices, which is what producers actually keep after a sale. Then statisticians add taxes on products and subtract subsidies to reach market prices: the amounts buyers actually pay.
Here’s a real example: A manufacturer values a washing machine at $400. The country charges 20% VAT, making the retail price $480. The government subsidizes energy efficient appliances with $100. You pay $380 at checkout.
The basic price ($400) reflects what the producer receives. The market price ($380) shows what you pay. The $80 difference comes from the $80 tax minus the $100 subsidy.
All three calculation methods have one purpose: they reduce uncertainty in the final GDP number. When the expenditure, output, and income approaches point to the same figure, you can trust the measurement more. When they diverge, economists dig deeper to find where the discrepancy hides.
Components of GDP: Breaking Down Economic Output
GDP’s four components reveal where economic activity actually happens: households buying goods and services, businesses investing in future production, and government purchasing everything from fighter jets to school supplies. Understanding each piece helps you see what drives growth in any economy.
Consumption: The Power of Household Spending
When you buy groceries, pay for a haircut, or stream a movie, you’re contributing to the largest slice of economic output. Personal consumption makes up about 68% of U.S. GDP, which explains why economists watch consumer spending so closely.
This component splits into three categories. Durable goods like cars and appliances last three years or more. Nondurable goods include food, fuel, and clothing that you consume quickly. Services cover everything from healthcare to banking to education.
Services now represent roughly 45% of total GDP on their own. That’s a big shift from decades past when manufacturing dominated. The growth reflects how modern economies have evolved, though services remain hard to export since most require in-person delivery.
Here’s why consumption matters so much: America’s large domestic population creates what amounts to a massive testing ground for new products. Companies get better at reading what consumers want. That feedback loop strengthens over time.
Investment: Fuel for Future Growth
Business investment tracks purchases companies make to produce future goods and services. In 2023, this accounted for $4.8 trillion or 18% of GDP. But there’s a catch: replacing worn-out equipment doesn’t count. Only new productive capacity adds to this number.
Fixed investment includes the machinery, software, and structures businesses buy. Manufacturing equipment, office buildings, and warehouses all fit here. New housing construction also counts, whether single-family homes or apartment complexes. Resales don’t add anything since they just transfer existing assets.
Inventory changes measure a different dynamic. When your orders exceed what companies have in stock, they build inventory. Rising inventories signal expected demand. Falling inventories often mean softening business conditions ahead, even though this component typically adds less than 1% to GDP.
The 2008 financial crisis showed how volatile this component can be. Residential construction dropped from $872 billion in 2005 to just $382 billion in 2010. Capital fled an entire sector when incentives shifted and risk became clearer.
Government Purchases: Policy and Public Goods
Government spending contributed $4.7 trillion or 17% of GDP in 2023. This includes everything from military hardware to teachers’ salaries to highway maintenance. Transfer payments like Social Security don’t count here since they just move money between people without producing new output.
Federal spending reached $1.8 trillion, with nearly 60% going to defense. State and local governments added another $3.0 trillion, funding schools, police, roads, and local services. These purchases represent policy choices about where to direct resources.
The government share has actually declined from 19% in 2006. That means government was buying more during the pre-recession boom than it does now relative to total output. This matters because government spending competes with private sector activity for labor, materials, and capital.
Net Exports, the fourth major component, typically subtracts from U.S. GDP since imports exceed exports. In 2023, this gap reached $799 billion as Americans bought more foreign goods than foreigners purchased American products.
Trade, Net Exports, and Their Economic Impact
When you look at GDP calculations, net exports represent the difference between what a country sells abroad and what it buys from foreign suppliers. This component captures how international trade flows either add to or subtract from domestic economic output.
Exports Versus Imports
Exports count as additions to GDP because they represent goods and services your country produced that foreigners purchased. When a factory in Ohio builds machinery that ships to Germany, that production counts toward U.S. economic output.
Imports work differently. When you buy a television made in South Korea, that purchase gets subtracted from GDP calculations. This isn’t because imports harm your economy. It’s an accounting adjustment.
Here’s why that matters. Consumer spending (one of the Components of GDP) includes everything households buy, whether made domestically or abroad. To measure only domestic production, economists subtract the imported portion. Otherwise, GDP would count foreign production as if it happened on your soil.
The calculation looks like this:
- Net Exports = Total Exports – Total Imports
- A positive number means exports exceed imports
- A negative number means imports exceed exports
Trade as a percentage of GDP shows how much your economy depends on international commerce. Some countries trade heavily; others focus more on domestic activity.
Trade Surpluses, Deficits, and GDP Fluctuations
A trade surplus happens when your country exports more than it imports. The net exports component adds to GDP growth. Countries like Germany and China have run persistent surpluses for years.
A trade deficit means imports exceed exports. This subtracts from GDP in the accounting sense. The United States has run trade deficits for decades. Does this automatically signal economic weakness? Not necessarily.
Capital flows tell a more complete story. When your country runs a trade deficit, foreigners end up holding your currency. They typically invest those dollars back into your economy through stocks, bonds, or real estate. This reveals something important: capital flows to where it is treated best.
Consider these dynamics:
- Rising imports might signal strong consumer demand and economic confidence
- Export growth can reflect competitive advantages or currency movements
- Deficits can coexist with robust GDP growth if consumption and investment remain strong
The relationship between trade balances and overall economic health is more complex than simple arithmetic suggests. Your economy might import raw materials, add value through manufacturing or services, then export finished products. The GDP calculation captures the value added domestically, not just the final trade balance.
Real vs Nominal GDP: The Critical Difference
When you look at GDP numbers, you’re seeing two fundamentally different measurements. One reflects actual economic output; the other includes price changes that can make growth look stronger or weaker than it really is.
Why Adjust for Inflation?
Nominal GDP measures output at current market prices. If your economy produces the exact same amount of goods this year as last year, but prices rise 5%, nominal GDP grows 5%. You didn’t actually produce more. Prices just went up.
This creates a problem when you want to understand real economic growth. A country could report 7% GDP growth, but if 6% came from inflation, actual output only grew 1%. That’s why economists strip out price changes to calculate real GDP.
Real GDP shows you volume changes. It answers this question: how much more (or less) did we actually produce?
Think of it this way. If a bakery made 100 loaves last year at $3 each and 100 loaves this year at $4 each, nominal revenue rose from $300 to $400. But real output stayed flat at 100 loaves. The difference between real and nominal GDP reveals whether growth comes from actual productivity gains or just rising prices.
This distinction matters for your economic analysis. Real GDP growth signals genuine expansion: more factories running, more services delivered, more value created. Nominal GDP growth might just mean inflation.
GDP Deflators and Price Indexes
The GDP deflator is the tool that converts nominal GDP into real GDP. It measures price changes across everything the economy produces: goods, services, government spending, and exports.
Here’s the basic math: Real GDP equals Nominal GDP divided by the GDP Deflator. The US Bureau of Economic Analysis calculates this deflator annually, using 2000 as a base year for comparison.
The deflator works differently than the Consumer Price Index you might hear about on the news. CPI tracks a fixed basket of consumer goods. The GDP deflator captures price changes for everything produced domestically, and the basket changes as production patterns shift.
This creates an interesting tension. A country’s nominal GDP almost always exceeds its real GDP because inflation generally runs positive. When you see a big gap between the two numbers, you’re looking at significant price increases rather than output growth.
You can use this framework to evaluate economic headlines. If nominal GDP jumped 8% but real GDP only rose 2%, you know inflation drove most of that headline number. Capital flows respond to real growth, not nominal illusions.
GDP Growth Rate Meaning: Trends, Cycles, and Signals
The GDP growth rate meaning centers on how quickly an economy expands or contracts over time. Understanding GDP growth patterns helps you interpret whether an economy is accelerating, slowing down, or entering troubled waters.
How GDP Growth Rates Are Calculated and Reported
GDP growth measures the change from one period to the next, typically comparing quarters or years. You calculate it by dividing the GDP of a later period by the GDP of an earlier period, then subtracting one and converting to a percentage.
The math looks straightforward. Take this year’s GDP, divide by last year’s GDP, subtract 1.0, multiply by 100. If GDP rises from $20 trillion to $20.5 trillion, that’s 2.5% growth.
But there’s a catch you need to watch for. Nominal growth includes inflation. Real growth strips out price changes to show actual production increases. When you see headlines about GDP growth, they usually reference real GDP.
Government agencies like the Bureau of Economic Analysis release GDP reports quarterly. They publish preliminary estimates first, then revise them as more complete data arrives. You’ll often see three versions: advance, second, and third estimates.
Historical GDP Trends and Economic Cycles
Economic growth moves in cycles rather than straight lines. Periods of expansion alternate with slowdowns and contractions.
The U.S. experienced six recessions between 1950 and 2011. Each cycle varies in length and severity. Some expansions last a decade; others peter out after a few years.
During boom periods, GDP growth accelerates. Companies hire aggressively. Investment increases. Consumer spending rises. These expansions can’t last forever because economies eventually hit capacity constraints.
Then growth slows. The pace of hiring drops. Business investment plateaus. Eventually, the economy may contract for two consecutive quarters, which economists typically define as a recession.
You can see these patterns clearly in the data:
- Expansion: GDP grows consistently, often 2-4% annually
- Peak: Growth reaches maximum rates before declining
- Contraction: GDP shrinks for multiple quarters
- Trough: Economy hits bottom before recovering
Interpreting Rise and Fall: Expansion, Slowdown, Recession
GDP growth rates signal where your economy stands in the business cycle. Strong growth above 3% typically means expansion. Weak growth below 1% suggests slowdown. Negative growth indicates contraction.
When GDP is growing strongly, employment usually increases as companies expand operations. Workers have more income. Consumer confidence rises. Capital flows toward productive investments.
But GDP growth alone doesn’t tell the complete story. You need context about inflation, employment, and productivity. An economy growing 4% with 5% inflation is actually shrinking in real terms.
Recession signals appear when growth turns negative. Two consecutive quarters of declining GDP marks the technical definition. But recessions involve more than just falling output: rising unemployment, declining business investment, and reduced consumer spending.
The relationship between GDP and recession matters for your financial planning. Recessions redistribute capital. Some sectors suffer while others adapt. Understanding these cycles helps you think probabilistically about economic conditions rather than being surprised by inevitable downturns.
GDP’s Role in Markets: Limits, Influences, and Investment Decisions
GDP reports move markets and shape policy choices. But the data comes with blind spots that matter for how you interpret economic signals.
How GDP Data Influences Markets
When quarterly GDP data gets released, you’ll see markets react within minutes. The advance report hits hardest because it’s the first snapshot of how the economy performed.
Here’s what happens: Strong GDP growth typically signals expanding corporate profits and higher consumer spending. That can push stock prices up and bond yields higher as investors expect future rate increases. Weak GDP growth does the opposite, sending capital toward safer assets.
But you need to look past the headline number. Real GDP adjusts for inflation while nominal GDP doesn’t. A 5% nominal growth rate might sound impressive until you realize 4% came from rising prices, not actual production gains.
Investors use GDP to assess where to allocate capital across countries and sectors. Fast-growing economies attract investment dollars, but only if that growth translates to real productivity gains rather than just inflation or debt-fueled consumption.
The data has limits you can’t ignore. GDP misses underground economic activity entirely. It also ignores how growth gets distributed: an economy can expand while most people fall behind if gains flow to a narrow slice at the top.
GDP and Policy: Central Banks and Fiscal Choices
Your central bank watches GDP obsessively because it reveals whether the economy needs stimulus or restraint. When GDP growth accelerates too fast, inflation risks build as labor and factories reach capacity limits.
That’s when rate hikes begin. Higher borrowing costs slow business investment and consumer spending, cooling the economy back down. When GDP contracts, the cycle reverses: lower rates make borrowing cheaper to stimulate activity.
Consumer spending drives over two-thirds of U.S. GDP, so your confidence as a consumer directly affects policy decisions. Government spending becomes especially important during downturns when businesses and households pull back.
The key tension: policymakers rely on GDP to make trillion-dollar decisions, yet the measure overlooks income inequality, environmental costs, and quality-of-life factors. Capital flows to where GDP grows fastest, but that doesn’t always mean where prosperity gets shared broadly or sustainably.
Beyond GDP: Limitations, Alternatives, and What Gets Missed
Comparing economies gets tricky when you look beyond headline GDP numbers. The size of total output tells you something different than output per person, and a dollar doesn’t buy the same amount everywhere.
GDP Per Capita Versus Total Output
Total GDP measures everything a country produces. GDP per capita divides that number by population.
The difference matters more than you might think. China’s economy produces around $18 trillion annually, making it the world’s second-largest by total output. But spread across 1.4 billion people, that’s roughly $13,000 per person. The United States produces about $27 trillion with 330 million people: over $80,000 per capita.
Total GDP tells you about economic power and market size. Per capita GDP tells you about average living standards.
India illustrates this gap clearly. It ranks as the fifth-largest economy by total output but falls to 139th in per capita terms. Large population, growing production, but still developing individual prosperity.
When you’re thinking about where capital flows, both numbers matter. Total GDP signals market opportunity. Per capita GDP signals purchasing power and productivity per worker.
Purchasing Power Parity: Comparing Across Borders
A dollar in New York doesn’t stretch as far as a dollar in Mumbai. Purchasing power parity adjusts for these price differences across countries.
Standard GDP uses market exchange rates. If Mexico’s peso trades at 20 to the dollar, you convert at that rate. But this misses something important: what that money actually buys locally.
PPP adjusts GDP based on local prices for goods and services. A haircut, restaurant meal, or apartment costs dramatically different amounts in different countries. PPP captures this reality.
China’s economy looks about 30% larger when you use PPP adjustments instead of market exchange rates. For India, the difference exceeds 200%. Cheaper local prices mean nominal GDP numbers understate actual purchasing power.
You need both measures. Market exchange rate GDP matters for international trade and investment flows. PPP-adjusted GDP better reflects actual living standards and domestic consumption capacity.
Frequently Asked Questions
GDP measures economic output, but interpreting what it means requires answering questions about its limits, alternatives, and what it actually tells you about prosperity.
How does GDP serve as a barometer for a country’s economic health?
GDP tracks the total value of goods and services produced within a country’s borders during a specific period. When GDP grows, it means more economic activity is happening. More production typically means more jobs, higher incomes, and increased business activity.
You can think of GDP as a vital sign for an economy, similar to how body temperature indicates physical health. A rising GDP suggests economic expansion. A falling GDP signals contraction.
But like any single measurement, GDP tells you something important without telling you everything. It shows the size and direction of economic activity. It doesn’t reveal how that activity is distributed or whether it improves your quality of life.
What are some common misconceptions about using GDP as the sole indicator of economic prosperity?
Many people assume higher GDP automatically means better living standards for everyone. That’s not always true. GDP can grow while most people experience stagnant or falling incomes if gains concentrate at the top.
Another misconception is that GDP captures all valuable economic activity. It misses unpaid work like childcare and volunteer efforts. It also ignores the underground economy where transactions happen without official records.
Some think GDP growth always signals progress. But GDP treats destructive events oddly. A hurricane destroys property, then rebuilding adds to GDP. The measurement counts the rebuilding without subtracting the destruction.
In what ways can GDP calculations be misleading when assessing the wellbeing of a society?
GDP doesn’t account for environmental costs. If factories produce more goods while polluting rivers, GDP rises even though long-term wellbeing might decline. The calculation adds production value but subtracts nothing for environmental damage.
You won’t find leisure time in GDP figures. If you work fewer hours to spend time with family, GDP might fall even though your life satisfaction increases. The metric values market transactions, not time or happiness.
GDP also ignores inequality in distribution. A country might show strong GDP growth while most citizens see little benefit. The aggregate number hides whether prosperity reaches broadly or concentrates narrowly.
How does the concept of ‘GDP per capita’ differ from GDP, and what additional insights does it provide?
GDP per capita divides total GDP by population size. This gives you average economic output per person rather than just the total national figure.
This measurement helps you compare countries of different sizes more fairly. China has a massive total GDP, but its GDP per capita is much smaller because it divides among 1.4 billion people. Luxembourg has tiny total GDP but very high GDP per capita due to its small population.
GDP per capita still shares the same limitations as regular GDP. It’s an average, which means it doesn’t show distribution. Half the population could be wealthy while the other half struggles, yet the average might look fine.
Could you explain the various components that make up GDP and how they contribute to economic analysis?
GDP consists of four main components. Consumer spending makes up the largest portion, typically around 70% in developed economies. This includes everything you buy: food, housing, healthcare, and services.
Business investment comes next. Companies spend on equipment, buildings, software, and inventory. This component reveals business confidence about future demand.
Government spending includes public services, infrastructure, and defense. Net exports represent the difference between what a country sells abroad and what it imports. When exports exceed imports, this adds to GDP; when imports exceed exports, it subtracts.
Each component tells you something about where economic activity originates. Strong consumer spending suggests household confidence. Rising business investment indicates optimism about future growth. The mix between components shifts as economies develop and respond to different conditions.
What alternative metrics are emerging to complement GDP in evaluating economic performance and growth?
The Genuine Progress Indicator adjusts GDP by adding beneficial activities like volunteering and subtracting costs like pollution and crime. It attempts to measure whether economic activity actually improves wellbeing.
The Human Development Index combines life expectancy, education levels, and income per capita. This gives you a broader view of development beyond pure economic output.
Happiness indexes survey citizens about life satisfaction directly. Bhutan famously tracks Gross National Happiness instead of focusing solely on economic growth. These subjective measures capture elements that GDP misses entirely.
Environmental accounting systems try to measure natural capital depletion. If you extract resources without accounting for their loss, traditional GDP shows gain. These alternatives attempt to show the true cost. The challenge is creating measurements as standardized and reliable as GDP while capturing more dimensions of prosperity.
THE INVESTOR’S ECONOMIC WIRE
Two decades of Wall Street insight. Five minutes to read.
Data, policy, and market signals — one daily briefing before markets open.
Free every weekday at 6 AM ET. Unsubscribe anytime.
Related ON1010 Research Guides
GDP is the broadest measure of economic health, but it connects to many other indicators. These guides cover the data points that feed into and flow from GDP:
Economic Calendar Guide — GDP is released quarterly, but monthly indicators like retail sales and industrial production offer real-time clues about where GDP is heading.
Jobs Report Explained — Employment drives consumer spending, which makes up roughly 70% of GDP. The jobs report is the best monthly signal for GDP momentum.
CPI Explained — The GDP deflator strips inflation from growth, but CPI offers a more timely read on price pressures that affect real GDP calculations.
Treasury Market Guide — GDP surprises can shift Treasury yields and reshape expectations for Fed policy. Understand how growth data flows through bond markets.
Stay Ahead of the Data
Get free daily economic analysis delivered to your inbox. Our AI-powered briefings break down the data that moves markets — in plain English.