
The Yield Curve Is Positive Again. That’s Actually the Tricky Part.
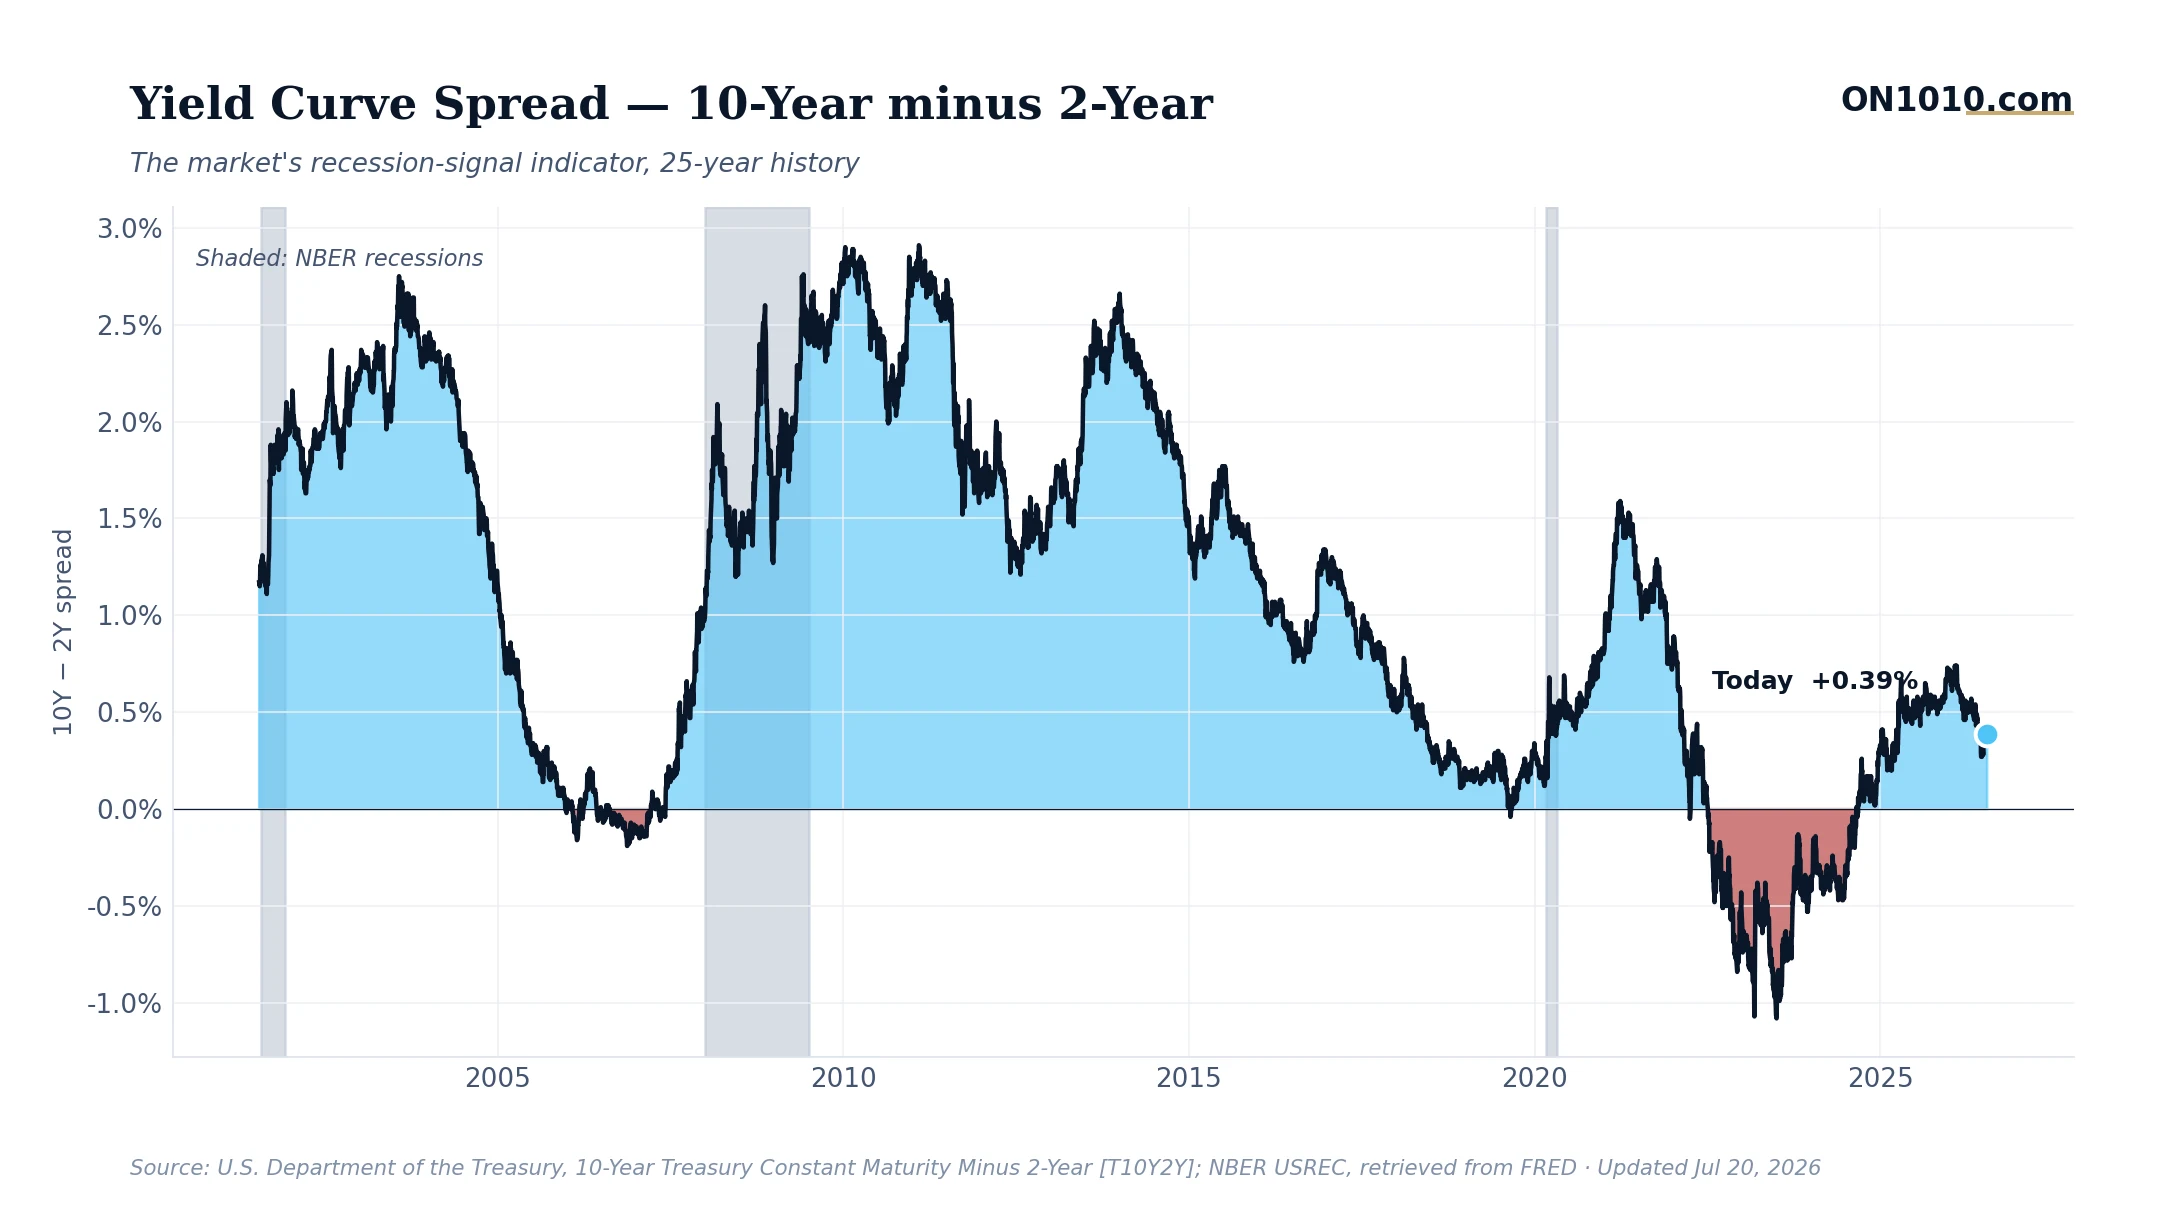
The 10-year minus 2-year Treasury spread ticked up to 0.39% on July 20, continuing a stretch of positive readings that would have looked impossible just a couple of years ago. After one of the longest yield curve inversions in modern history, the curve has quietly normalized. That normalization deserves more attention than it’s getting.
The Bigger Picture
The 2022-2024 inversion was historically deep and historically long. The spread spent nearly two years in negative territory, and traditional recession models flagged it loudly. What followed was slower growth and real stress in rate-sensitive sectors, but not the textbook recession many expected. Now the curve has been positive for several months, hovering in the 0.36% to 0.42% range, and the question shifts from “when does the recession arrive” to “what does a normalized curve actually mean from here?”
History offers a complicated answer. The yield curve’s recession signal doesn’t come from the inversion itself. It tends to come from the re-steepening that follows. When short-term rates fall faster than long-term ones, usually because the Fed is cutting into economic weakness, the spread widens quickly. That’s the pattern that has historically lined up with unemployment rising and growth softening. The 0.39% reading today is a gentle positive slope, not a dramatic steepening. Context matters enormously.
Why It Matters
In past cycles, investors and business operators have watched whether the curve’s slope is driven by falling short-term rates or rising long-term ones. Rising long rates can signal stronger growth expectations or inflation concern. Falling short rates often signal Fed easing into weakness. Those two roads look the same on a spread chart but lead to very different places. The current sector rotation toward health care and defensive names suggests the market isn’t fully convinced this is a clean growth story.
Bottom Line: The yield curve is no longer flashing red, but a positive spread isn’t automatically a green light. The question worth sitting with is what’s driving the shape right now, because the mechanism matters more than the number.
Source: Federal Reserve Economic Data (FRED)
ON1010 Research is an independent publisher of economic education and is not a registered investment adviser, broker-dealer, or investment company. This content is for educational and informational purposes only and is not investment advice or a recommendation to buy, sell, or hold any security. Published under the publisher exemption recognized by Section 202(a)(11)(D) of the Investment Advisers Act of 1940 (Lowe v. SEC). Always consult a qualified financial professional before making any financial decision.
Free Research
The economy moves fast. We make sure you move faster.
Economic data, policy shifts, and market signals — delivered to your inbox.
Subscribe Free