
The Yield Curve Is Positive Again. Here’s Why That’s the Complicated Part.
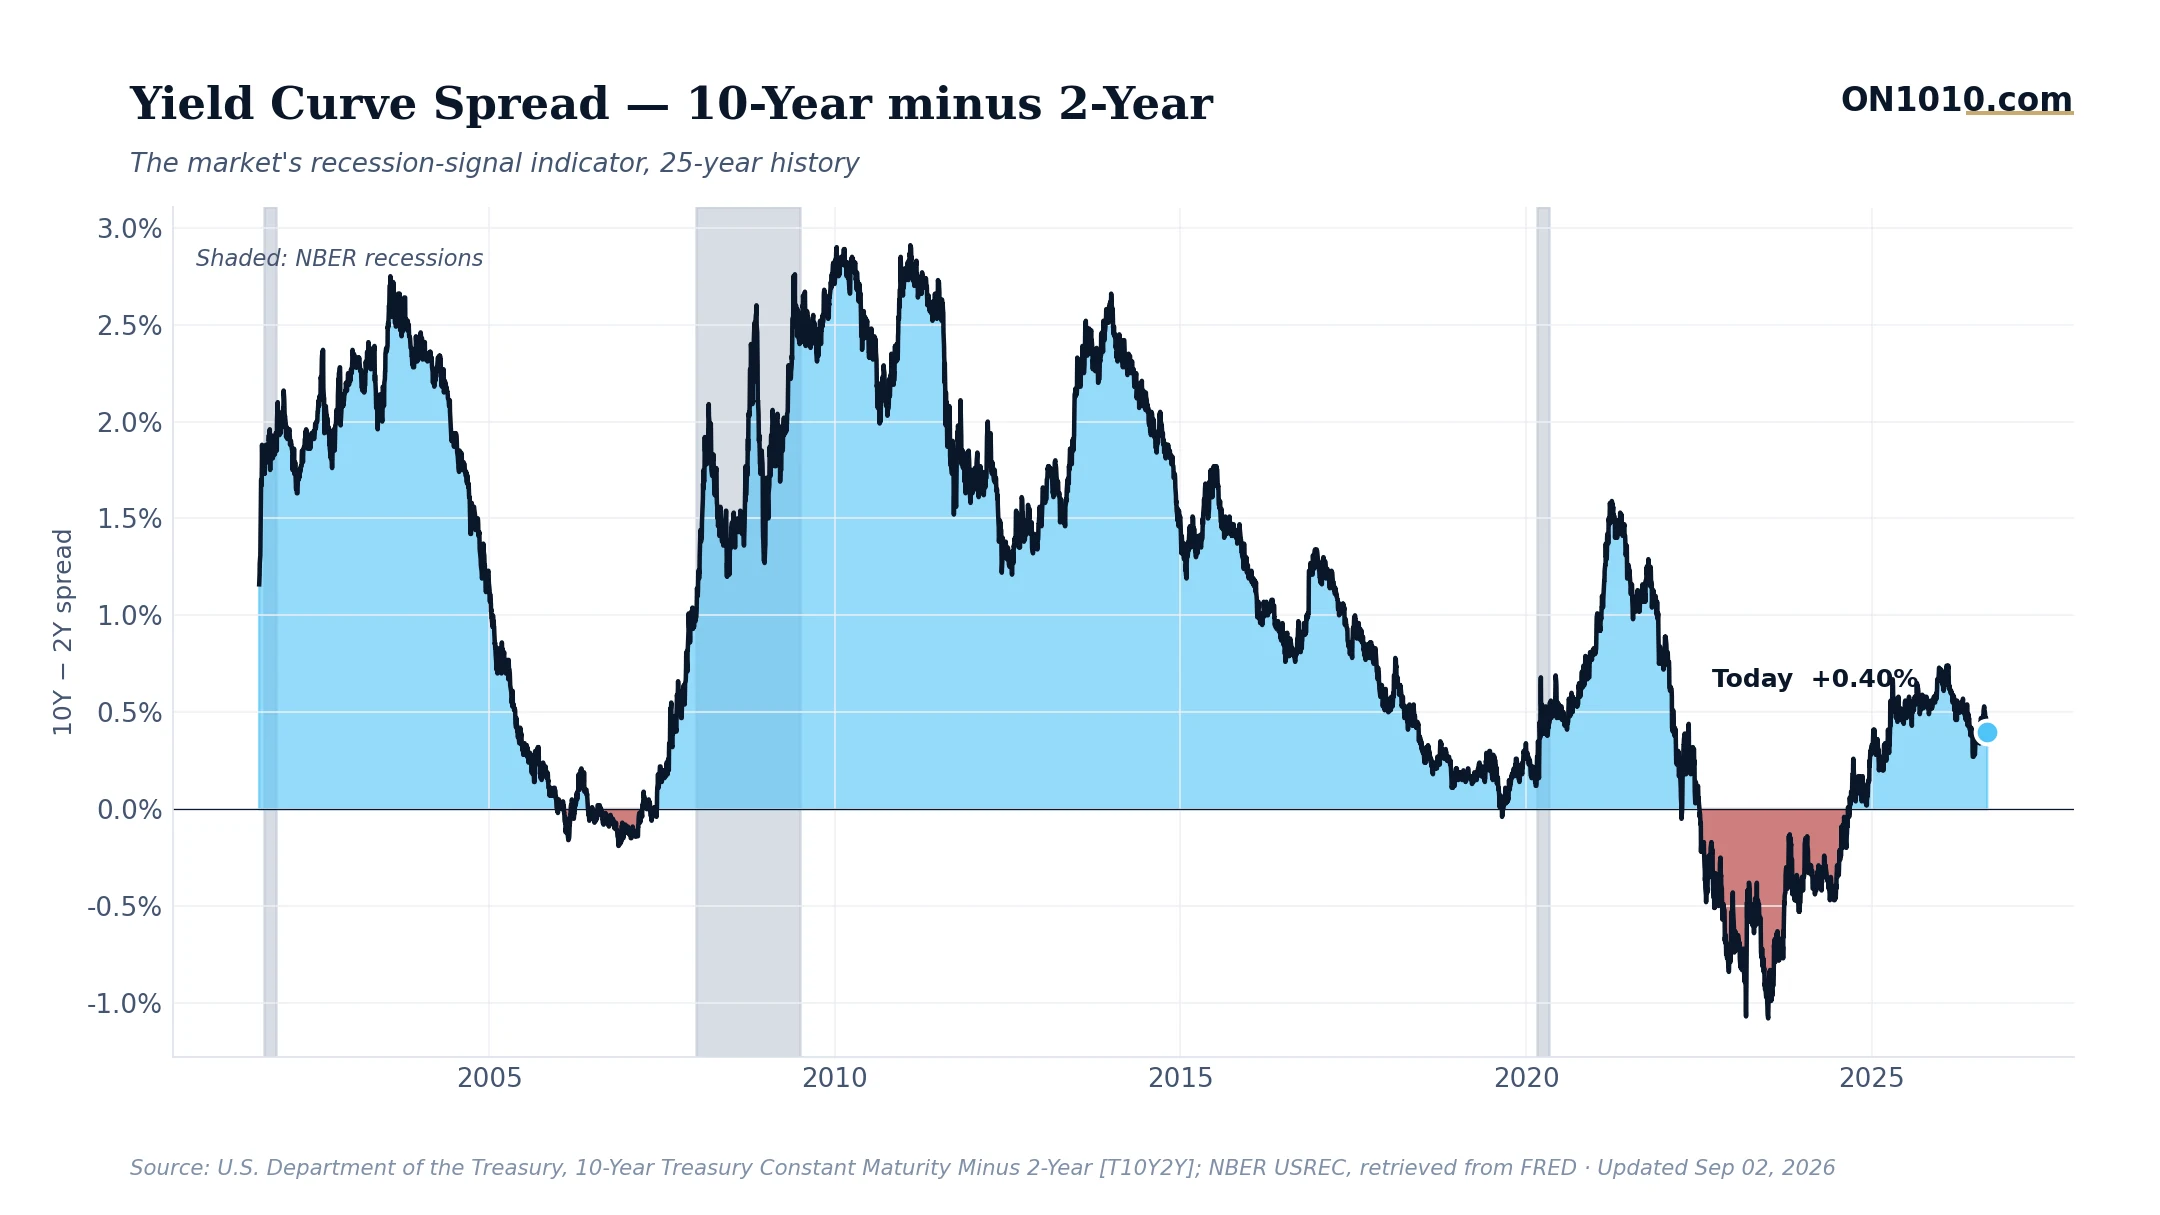
The 10-year/2-year Treasury spread has been sitting quietly at +0.4% for two straight days, holding a narrow but positive range between 0.39% and 0.47% over the past week. That sounds like good news, and in some ways it is. But the story of this number is really about what happened before it got here.
The Bigger Picture
This spread spent much of 2022 through 2024 deeply inverted, with short-term yields running well above long-term yields, a configuration that, in past cycles, has preceded recessions with notable consistency. The curve is no longer inverted. That’s called a “disinversion,” and it tends to draw less attention than the inversion itself, even though the disinversion is often where the action actually begins.
Historically, this is where the curve’s warning system gets misread. The inversion warns of trouble ahead. The return to positive territory often marks the moment conditions actually start to tighten in the real economy, as the Fed begins cutting rates (pushing short yields down) while long-term yields stay elevated, reflecting either persistent inflation or rising debt concerns. The curve looks “healthier” at exactly the moment the effects of the prior inversion start showing up.
Why It Matters
In past cycles, investors and business operators have watched the post-inversion phase closely because it often coincides with credit tightening, slower hiring, and margin pressure in rate-sensitive sectors. Right now, the broader gauge picture adds texture: long-term rates remain high by historical standards, core inflation is running hot, and credit spreads are tight. That combination historically calls for careful balance sheet thinking, because refinancing costs and borrowing assumptions built in 2020 or 2021 look very different against today’s rate environment.
Bottom Line: The yield curve returning to positive is a milestone worth marking, but the question worth sitting with is this: if the curve’s inversion was the warning, what does history suggest about what comes next in the 12 to 18 months that follow?
Source: Federal Reserve Economic Data (FRED)
ON1010 Research is an independent publisher of economic education and is not a registered investment adviser, broker-dealer, or investment company. This content is for educational and informational purposes only and is not investment advice or a recommendation to buy, sell, or hold any security. Published under the publisher exemption recognized by Section 202(a)(11)(D) of the Investment Advisers Act of 1940 (Lowe v. SEC). Always consult a qualified financial professional before making any financial decision.
Free Research
The economy moves fast. We make sure you move faster.
Economic data, policy shifts, and market signals — delivered to your inbox.
Subscribe Free