
The 10-Year Yield Has Been Sliding All Week. Here’s What the Bond Market Might Be Telling Us.
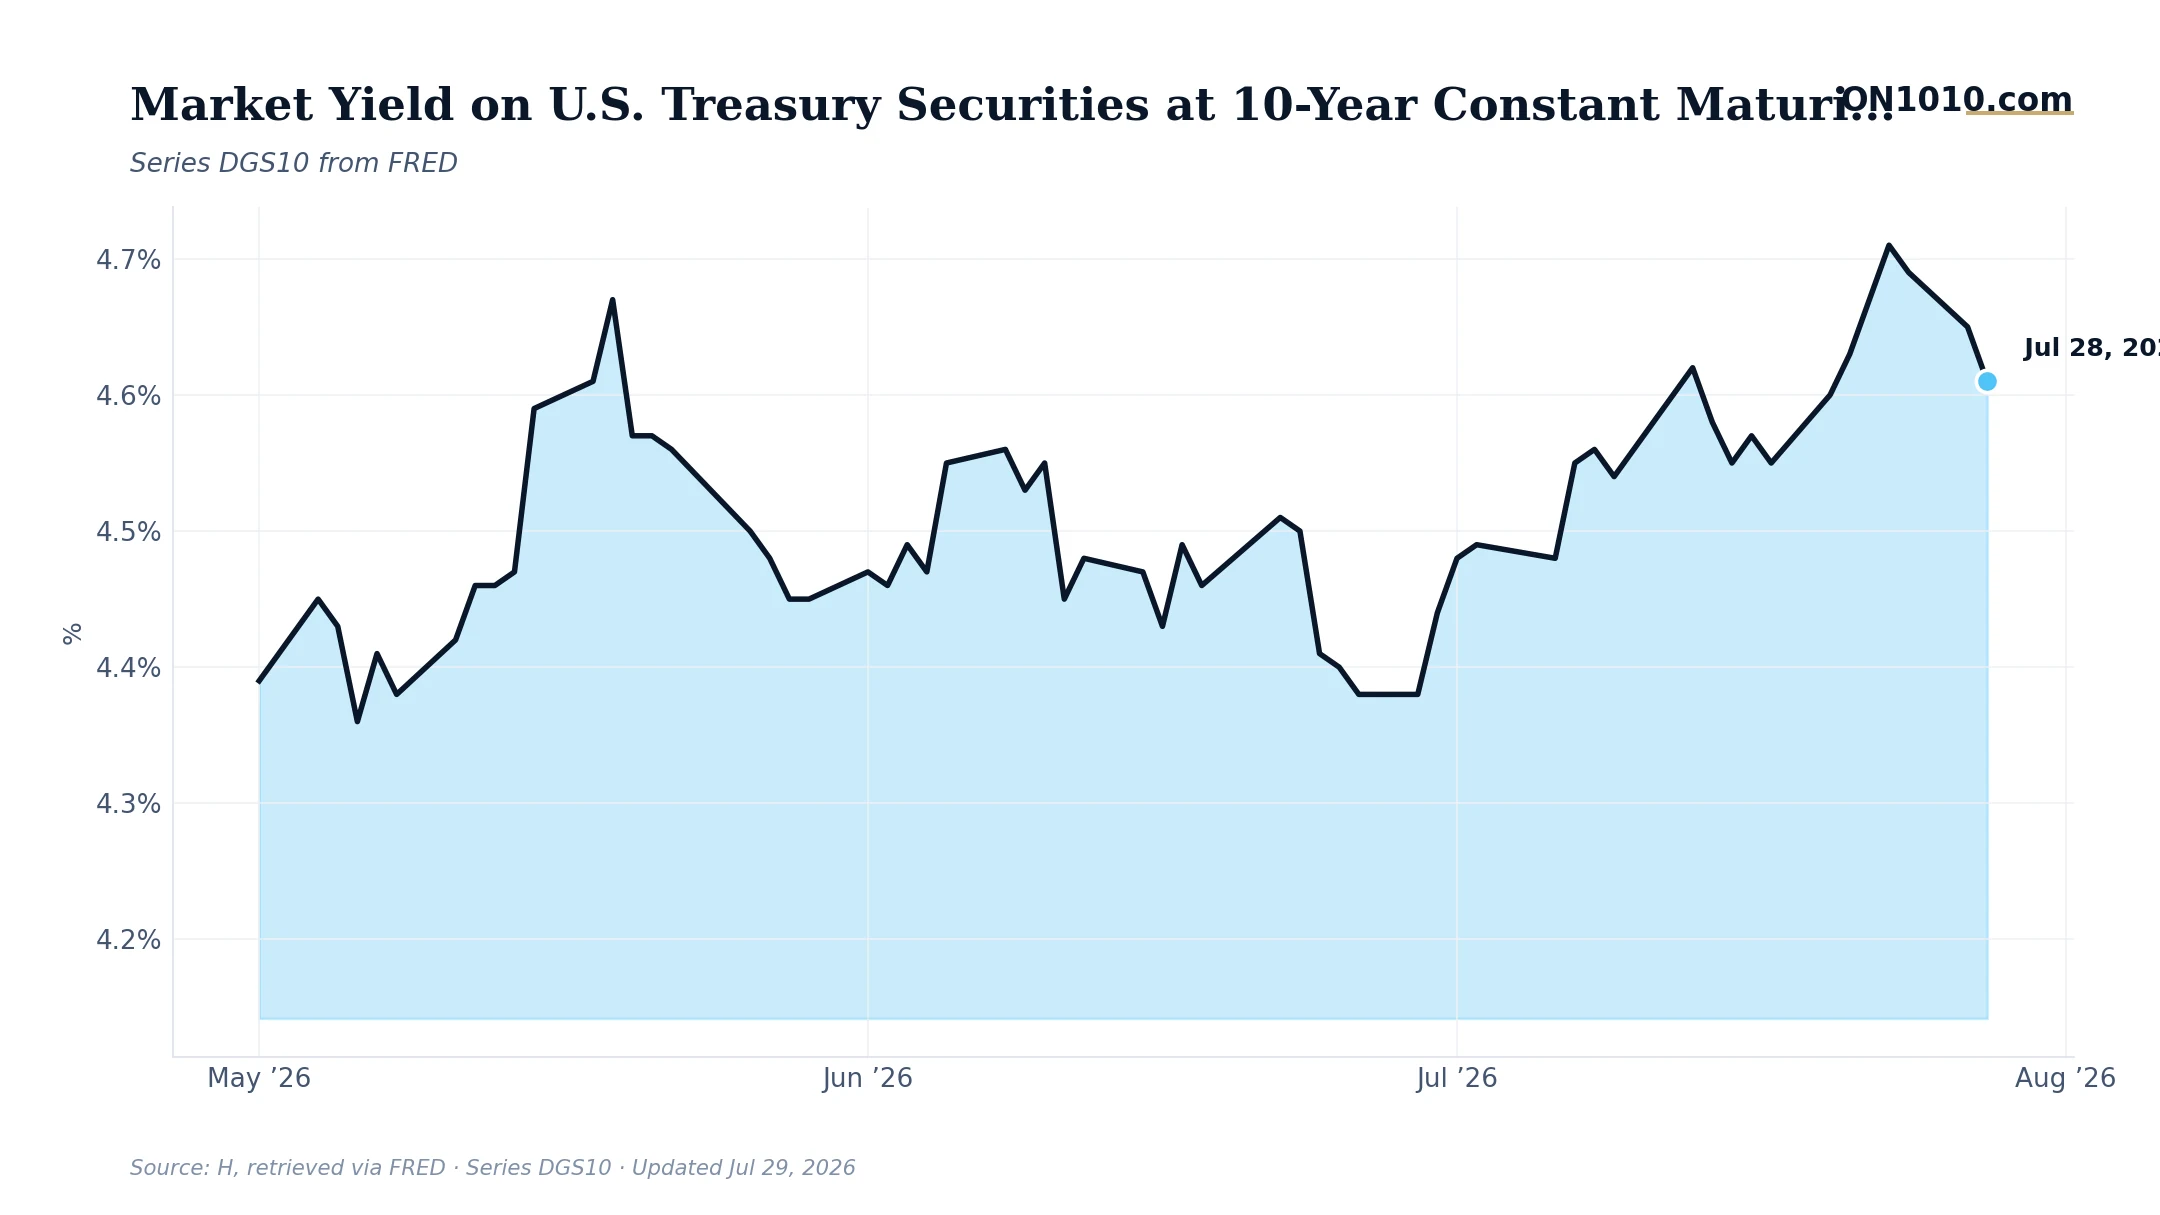
The 10-year Treasury yield dropped to 4.61% on July 28, down from 4.65% the prior session and off a recent peak of 4.71% on July 23. That’s a five-day slide of 10 basis points, quiet enough to miss in the headlines, but worth paying attention to when you look at the backdrop.
Here’s the tension. Inflation sits at the 92nd percentile of its historical range and is still rising. Growth is roughly neutral. Consumer sentiment is historically weak. Yet bond yields are pulling back, not pushing higher. Bond investors are essentially saying they see less reason to demand extra compensation for holding long-term debt than they did five days ago. Whether that reflects fading growth expectations, a softer inflation outlook, or simply a repositioning moment is the question worth sitting with.
The broader context makes this more interesting. Credit spreads are tight, sitting at the 22nd percentile, meaning the corporate bond market is calm and not pricing in distress. Rate policy is near its historical midpoint and drifting lower. Both of those signal a functioning economy, not a breaking one. At 4.61%, the 10-year sits at the 72nd percentile of its historical range, high by modern standards, still applying real friction to mortgage rates, corporate refinancing, and equity valuations.
Historically, when long-term rates have sat in this range, a recession began within the following 12 months about 18% of the time. That’s worth knowing, though it also means it didn’t happen 82% of the time. In past cycles, investors and business operators have watched whether rates drift lower because growth is softening, or because inflation is actually coming in cooler. The mechanism matters enormously for how assets reprice.
Bottom Line: Yields are easing, credit is calm, and growth is holding near its historical norm. The question the bond market is quietly asking: is this a soft landing finding its footing, or the early exhale before something cools more than expected?
Source: Federal Reserve Economic Data (FRED)
ON1010 Research is an independent publisher of economic education and is not a registered investment adviser, broker-dealer, or investment company. This content is for educational and informational purposes only and is not investment advice or a recommendation to buy, sell, or hold any security. Published under the publisher exemption recognized by Section 202(a)(11)(D) of the Investment Advisers Act of 1940 (Lowe v. SEC). Always consult a qualified financial professional before making any financial decision.
Free Research
The economy moves fast. We make sure you move faster.
Economic data, policy shifts, and market signals — delivered to your inbox.
Subscribe Free