
The 2-Year Treasury Is Quietly Sliding. Here’s What That Drift Is Actually Saying.
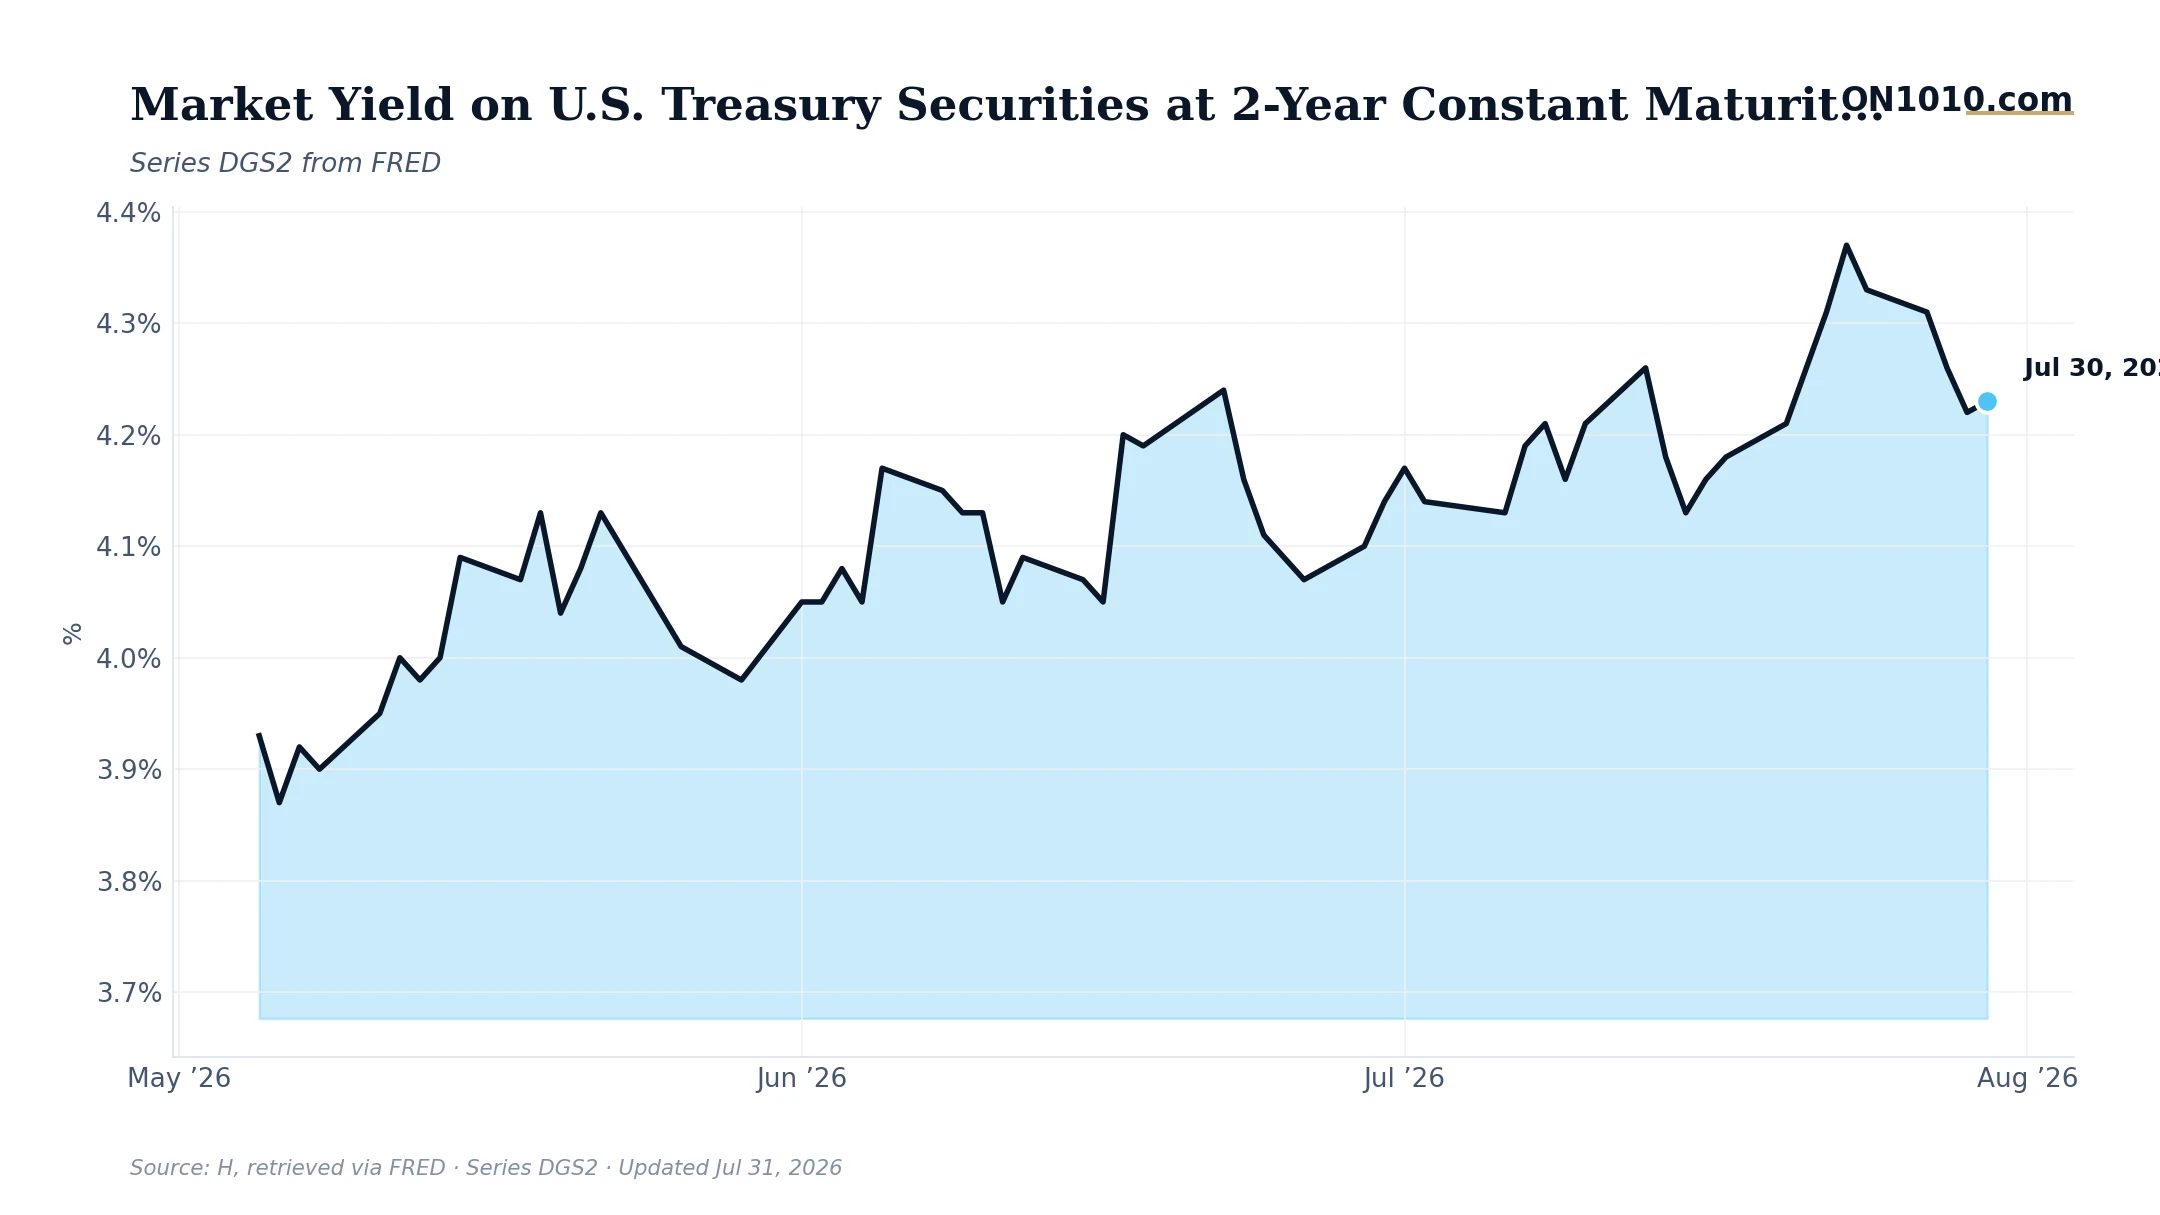
The 2-year Treasury yield settled at 4.23% on July 30, barely a whisper above the prior day’s 4.22%. The number itself is almost boring. The direction it came from is the story.
Over the past week, the 2-year has slipped from 4.37% to 4.23%, a 14 basis point decline in seven trading sessions. That’s the bond market quietly repricing Fed expectations downward, meaning traders are growing incrementally less certain that the Fed needs to stay aggressive. When the 2-year falls, it’s the market placing a smaller bet on near-term rate hikes.
Zoom out and the backdrop gets more interesting. Inflation sits at the 91st percentile of its historical range, which is genuinely hot. But the monetary policy gauge is neutral, and credit spreads remain tight, meaning corporate borrowers aren’t seeing stress. That’s a tension worth watching: high inflation readings historically pull yields up, but money is still flowing freely in credit markets and the 2-year is drifting lower. Something has to give.
The market signals add another layer. Technology is lagging SPY by 7.1% over the past month while consumer staples, health care, and real estate are each outperforming by more than 3.5%. That’s a rotation toward income and stability, exactly the kind of repositioning that has historically followed a period when investors start questioning whether high rates can hold.
In past cycles, a steadily declining 2-year yield during an elevated inflation environment has marked one of two things: either the market correctly sniffed out a coming Fed pivot before the data confirmed it, or it got ahead of itself and gave some of that move back when inflation proved stickier than expected. Historically, when interest rates have sat at today’s percentile level (73rd), a new recession began within the following 12 months about 19% of the time. That is not a prediction. It is the base rate worth knowing.
The question businesses and capital allocators are sitting with right now: is this yield drift a signal that easier money is genuinely on the way, or is it the market running ahead of an inflation picture that hasn’t fully softened yet?
Bottom Line: The 2-year is telling one story, inflation is telling another, and the bond market is betting on who blinks first. Watch whether this drift continues or reverses as the next inflation prints arrive.
Source: Federal Reserve Economic Data (FRED)
ON1010 Research is an independent publisher of economic education and is not a registered investment adviser, broker-dealer, or investment company. This content is for educational and informational purposes only and is not investment advice or a recommendation to buy, sell, or hold any security. Published under the publisher exemption recognized by Section 202(a)(11)(D) of the Investment Advisers Act of 1940 (Lowe v. SEC). Always consult a qualified financial professional before making any financial decision.
Free Research
The economy moves fast. We make sure you move faster.
Economic data, policy shifts, and market signals — delivered to your inbox.
Subscribe Free