
Consumers say recession. Lenders disagree.
Consumers Are Screaming Recession. Lenders Are Ignoring Them.
American households are about as pessimistic as they have ever been in the seventy years anyone has bothered to ask them. The sentiment surveys are sitting near the very bottom of their entire recorded range, and they are still falling. If you read those surveys in isolation, you would prepare for a downturn.
Then you look at what lenders are actually doing with their money, and the picture inverts completely. Credit spreads, which measure how much extra interest lenders demand before they will take on risk, are near the tightest levels in recent memory. Lenders are charging almost nothing extra to take on risk, which is what credit looks like when nobody is worried. The jobs market added another wrinkle this week: July payrolls actually declined by 23,000, the first monthly loss in several years, yet the unemployment rate fell to 4.1%, its third straight monthly improvement. The pump is charging $4.08 a gallon, up 28% from a year ago. So which signal do you trust when they point in opposite directions?
In this brief: why credit has historically been the more reliable signal, what the July jobs number actually means when both pieces of it are true, and what the profit picture says about where this economy is actually heading.
Credit Markets Have Called This Right Before. Here Is Why They Probably Are Again.
Start with the contradiction and take it seriously, because both sides have real data behind them.
The case for worry is not nothing. Households feel squeezed, and they have reasons. Gas at $4.08 a gallon is 28% higher than it was a year ago. Mortgage rates climbed to 6.69% this week, their fourth straight weekly increase. The 10-year Treasury yield sits at 4.69%, and the government's own borrowing costs keep drifting higher, which means the cost of capital is real and rising across every corner of the economy. Nominal wages are up, but when you run the math against what gasoline and groceries are actually costing, some households are standing still at best.
The case for calm is equally concrete. Credit spreads are at the tightest levels in recent memory. Lenders are choosing, with real money, to charge almost no premium for risk. Job openings, while down slightly in June, remain 7.36 million, still well above pre-pandemic norms. Voluntary quits rose to 3.23 million in June, up 4.4% year over year, which is what the labor market looks like when workers feel confident enough to leave jobs voluntarily. Total hires climbed to 5.35 million, nearly 4% above a year ago.
What Seventy Years of Data Says About This Specific Fight
We went back through every comparable moment in our historical database, searching for months where consumer sentiment sat near historic lows while credit spreads sat near historic tights. The finding is not subtle. From sentiment readings this low, a new recession began within the following twelve months essentially zero percent of the time. A year later, conditions typically improved. The mood survey turns out to be capturing something real, but it is not a reliable leading indicator of recession. It captures how people feel, not what they are actually doing with their finances.
Credit markets, by contrast, capture behavior. When lenders tighten spreads, they are betting with money that borrowers will keep paying. When households say they feel terrible but keep servicing their debt, the lender is watching the behavior, not the mood. These two things can diverge for a long time, and historically the lender has been the one holding the more useful signal.
This does not mean the pessimism is irrelevant. It is real, and the distribution matters. High-income households are largely the ones investing into a calm credit market. Lower-income households, facing $4 gas and a 6.69% mortgage, are the source of the sentiment weakness, and their actual spending, not their survey answers, is the variable worth monitoring for any demand-side inflection. The economy is not uniformly fine, even if the aggregate credit picture is.
The July Jobs Report Is Not One Number
The headlines this week fought each other, and both were accurate. Total nonfarm payrolls fell 23,000 in July, the first monthly decline in several years. That is a real data point and it deserves honest treatment. At the same time, the unemployment rate dropped to 4.1%, its third consecutive monthly improvement after stalling at 4.3%. Jobless claims came in at 199,000, essentially flat and historically consistent with a healthy labor market.
How can payrolls fall and unemployment also fall? The two measures come from different surveys. Payrolls count jobs at businesses. Unemployment measures households, including self-employment and gig work. When those two series diverge, the honest answer is that the labor market is in transition, and one month of data should never change your view. The rule here is simple: require a surprise to repeat before it changes the trend. One month of negative payrolls in a context of falling unemployment and near-record-low jobless claims is a puzzle worth watching, not a verdict.
The Profit Story Is the One Most People Are Missing
Here is the part of this week's picture that tends to get buried under the jobs headline noise. Domestic corporate profits are estimated to have grown at a 37% annual rate in the second quarter, reaching 12.9% of GDP. Compensation, meanwhile, rose at just 3.7% annually, well below nominal output growth of nearly 8%. Productivity, output per worker per hour, rose 2.24% over the past year. When productivity rises, companies can pay workers more without squeezing margins, and they can grow without stoking inflation. That combination is running right now.
High profits at the business level are the leading indicator that matters most. They come before hiring decisions, before capital investment commitments, before stock prices adjust. When margins are expanding, the incentive structure for businesses to keep investing is intact. Our historical analog work places the current setup alongside months like late 1995, late 1996, and late 2007. From similar configurations, the following twelve months were positive about 80% of the time, above the long-run base rate of 74%. The recession probability from similar readings runs around 12%, below the historical average of 15%.
That is not a forecast. It is a base rate, and base rates exist to be updated as new data arrives. The honest watch item here is the second derivative: profits are expanding, but the growth gauge is drifting lower at the margin. The question worth sitting with is whether July's payroll dip is noise or the first data point in a softening trend. One number is not a trend. Two would start a conversation.
What This Means for Anyone Committing Capital Right Now
The yield curve is positive at 0.46% (the 10-year Treasury at 4.69% minus the 2-year at 4.25%), and the bond market's inflation expectation over the next decade sits at 2.25%. Lenders are not pricing imminent stress. The market itself is sitting above its long-run trend lines, and volatility, measured by the VIX at 14.9, is well below its historical norm, meaning traders are not hedging aggressively against near-term disruption.
The risk in this environment is not recession. It is complacency. Tight credit conditions and calm volatility can persist longer than skeptics expect, but the reversals, when they arrive, tend to be rapid. Balance sheets that used this window to take on duration risk without building buffers are the ones that get exposed first. The cost of capital is elevated and real, and any financing decision made today carries that rate as its baseline. That is the honest framing. For specific decisions about borrowing, refinancing, or capital commitments, the right conversation is with a qualified financial professional who knows the specifics of your situation.
Lenders are betting with real money that borrowers stay current, and across seventy years of data, the credit market has been the more reliable guide when it fights the sentiment survey.
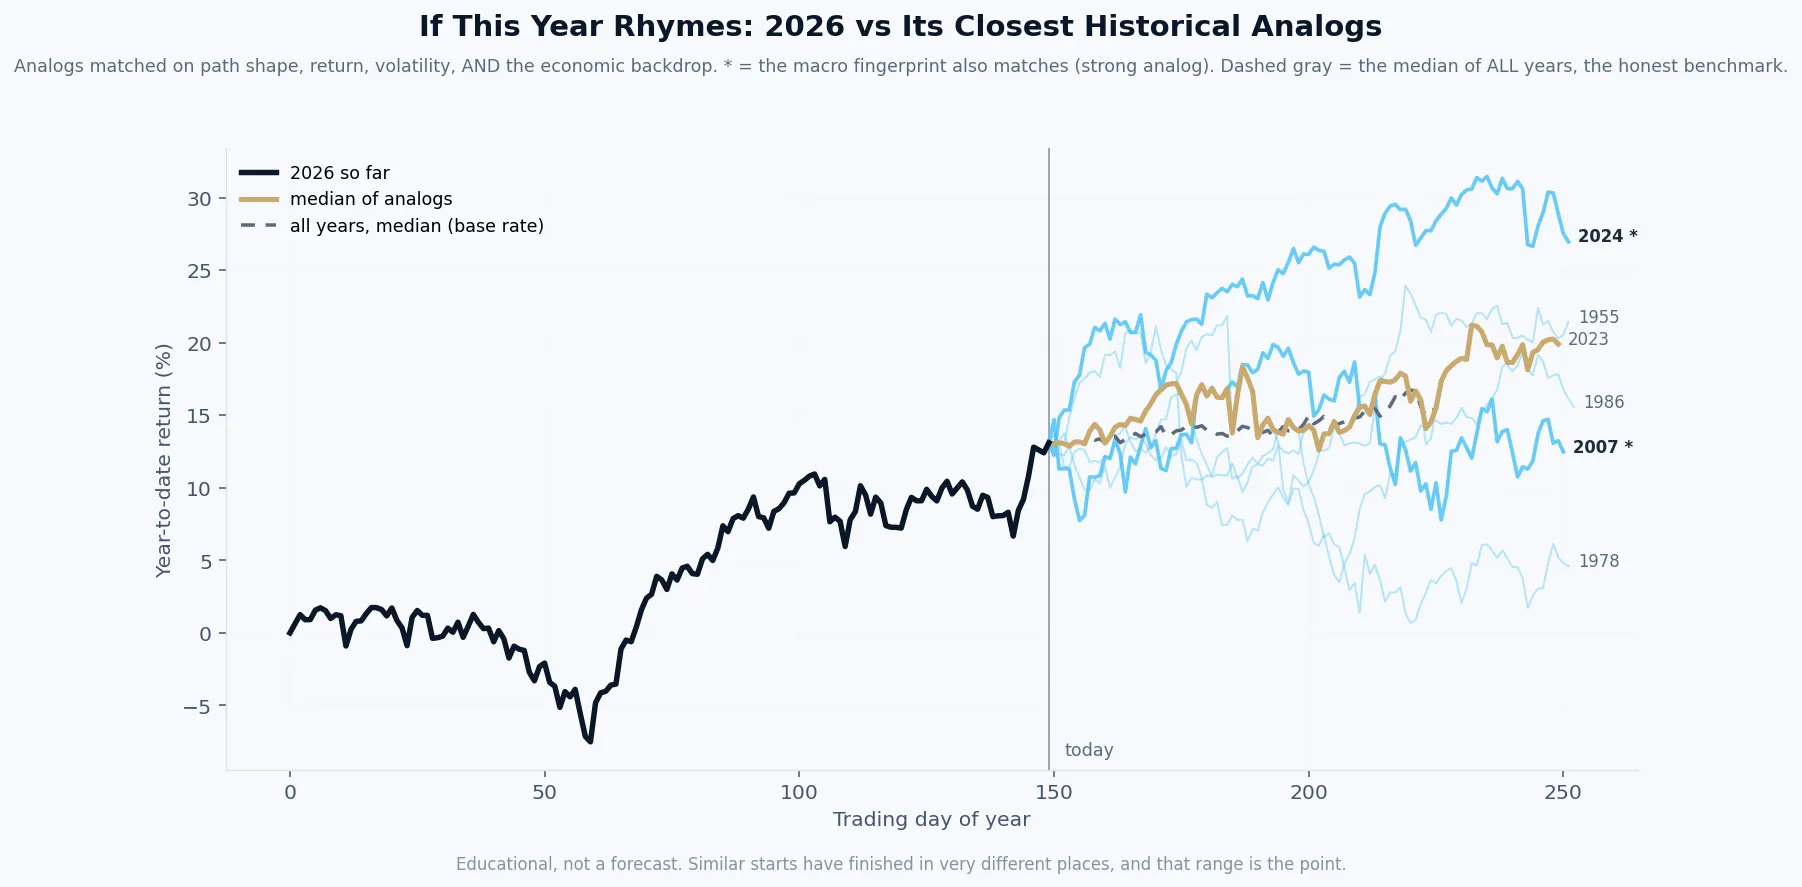
By this week's economic fingerprint, 2026 most closely resembles 1955, then 2023.
What it is. The black line is this year’s market path so far. Each colored line is a past year that our model ranks among the most similar to this one, matched on the shape of the path, its volatility, and the economic backdrop: inflation, interest rates, credit, employment, and more. A star means the economic fingerprint matches especially closely.
How it is built. Rebuilt every week from seventy years of data, using only information that was actually available at each point in history. The years are ranked by the model, not chosen by us.
What it is not. A prediction. Our own testing shows this tool has no ability to forecast where the market finishes the year, and we publish that finding on purpose. What it offers is context: the range of what followed similar setups, so a decision maker can plan for a range instead of betting on a point. The spread between those lines is usually the real lesson.
| Tue | NFIB Small Business Optimism for July: if small business owners report tightening credit access or falling sales expectations, it would be the first hard confirmation that the pessimism in consumer surveys is feeding into actual business behavior. |
| Wed | CPI for July: core inflation running hot relative to nearly all of history is the one gauge that could force the Fed's hand even if the labor market softens, so a surprise above or below 0.2% monthly would land hard across every rate-sensitive decision. |
| Thu | PPI for July: producer prices lead consumer prices by a few months, and with corporate profit margins at 12.9% of GDP, any sign of input cost acceleration would be the first test of whether those margins can hold. |
| Thu | Weekly jobless claims: one month of negative payrolls demands verification, and claims running below 200,000 would argue strongly that July's jobs decline was a survey anomaly rather than the start of a trend. |
| Fri | University of Michigan Consumer Sentiment preliminary read for August: sentiment is already near the bottom of its entire recorded range, so the number that matters here is whether it stabilizes or sets a new low, which would extend the divergence with credit markets into its most extreme territory on record. |
Free Research
The economy moves fast. We make sure you move faster.
Economic data, policy shifts, and market signals — delivered to your inbox.
Subscribe Free