
The 2-Year Treasury Is Parked. That’s Actually Saying Something.
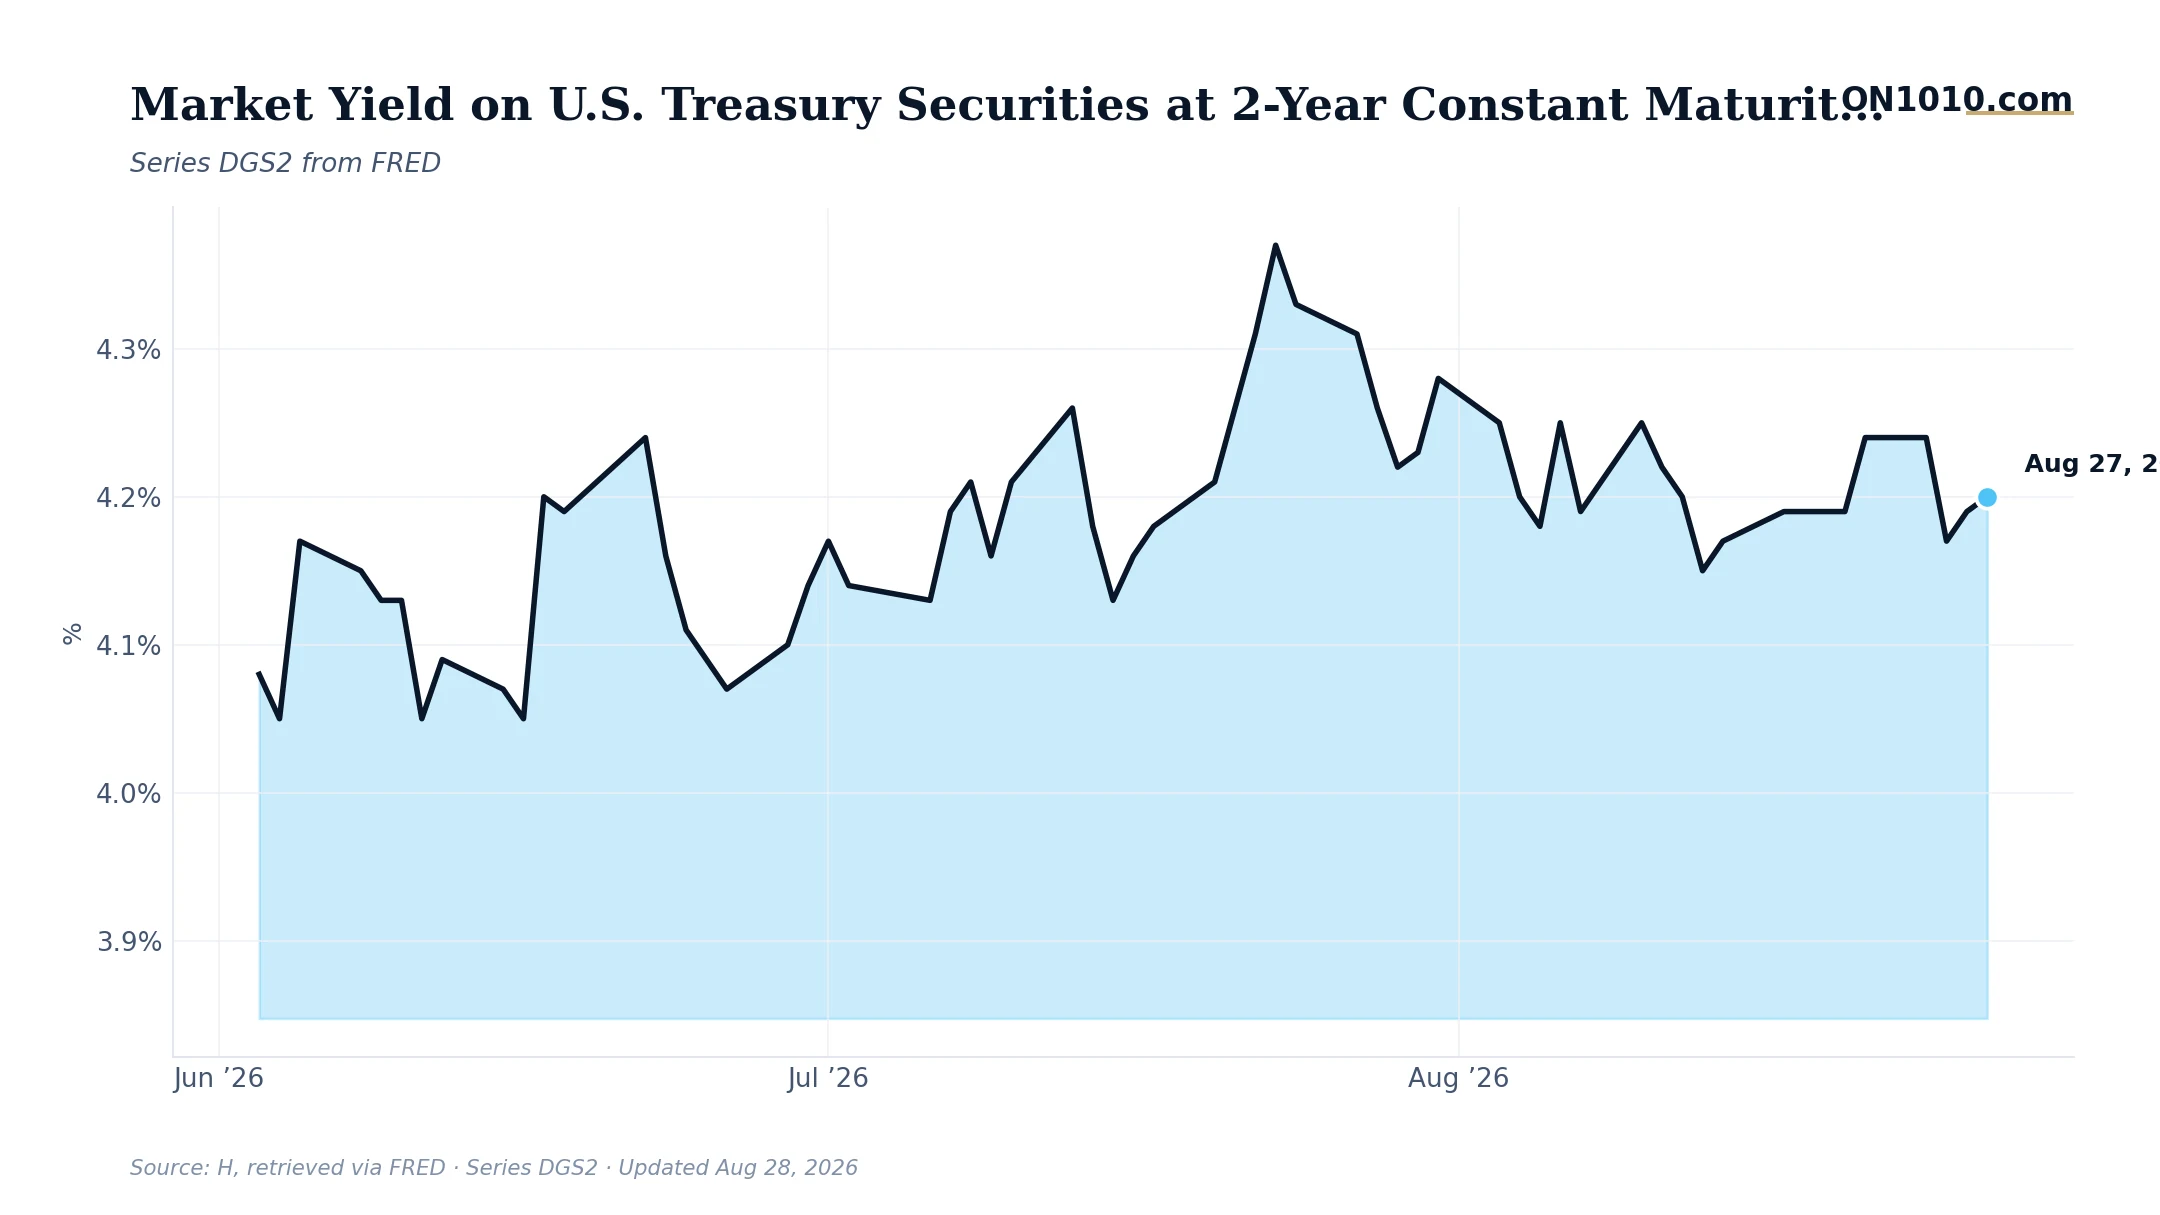
The 2-year Treasury yield barely moved this week, edging up from 4.19% to 4.20% over the past two days after a narrow 7-basis-point range across the full week (4.17% to 4.24%). That kind of stillness in the bond market is easy to scroll past. It shouldn’t be.
The 2-year yield is the market’s best real-time read on what the Fed will do with short-term rates over the next couple of years. When it’s moving sharply, traders are repricing their Fed expectations fast. When it parks itself in a tight range around 4.20%, the market is essentially saying: “We think we know what the Fed is going to do, and we’re not changing our minds.” That’s a consensus position, and consensus positions in bond markets can unwind quickly when data surprises.
What makes this particularly interesting is the tension between that calm signal and the broader picture. Core inflation is running well above its historical norm. Long-term rates are historically elevated, and historically, periods with that kind of rate environment have preceded a new recession within 12 months about 19% of the time. That is not a prediction. It is the base rate worth knowing. Meanwhile, credit spreads are historically tight, which suggests corporate credit markets see little near-term stress.
In past cycles, when the 2-year yield plateaued like this, business operators and capital allocators watched it closely as a proxy for financing cost stability. A yield that holds steady gives CFOs a cleaner picture for modeling borrowing costs. A yield that breaks higher signals that the market has decided the Fed stays tight longer, which raises the hurdle rate for new investment across the economy.
Bottom Line: The 2-year yield sitting quietly at 4.20% looks boring on the surface. Underneath, it reflects a market that has reached a tentative conclusion about the Fed. The question worth sitting with: what piece of data would be strong enough to break that consensus, and what happens to financing costs if it does?
Source: Federal Reserve Economic Data (FRED)
ON1010 Research is an independent publisher of economic education and is not a registered investment adviser, broker-dealer, or investment company. This content is for educational and informational purposes only and is not investment advice or a recommendation to buy, sell, or hold any security. Published under the publisher exemption recognized by Section 202(a)(11)(D) of the Investment Advisers Act of 1940 (Lowe v. SEC). Always consult a qualified financial professional before making any financial decision.
Free Research
The economy moves fast. We make sure you move faster.
Economic data, policy shifts, and market signals — delivered to your inbox.
Subscribe Free