
Gloomy households have never once called the next recession
Gloomy Households Have Never Once Called the Next Recession.
Corporate profits after tax hit $4.3 trillion annualized in Q1 2026, up 28% from a year earlier. Margins as a share of the economy reached 12.9%, the highest on record outside of post-recession bounces. Equities are within 2% of all-time highs. Lenders are charging almost nothing extra to take on risk, which is what credit looks like when nobody in the financial system is genuinely worried.
And yet the workers inside those profitable companies have never been gloomier in the seventy years anyone has thought to ask them. Consumer sentiment sits near the very bottom of its historical range. Real wages, what an hour of work actually buys after inflation, fell 0.2% in July, nearly wiping out June's entire gain. Gas just crossed $4 a gallon nationally. The people running the economy and the people living inside it appear to be describing two completely different places.
In this brief: why profits and sentiment are pulling in opposite directions right now, what our historical research says about which signal has actually predicted what comes next, and what the answer means for anyone making a hiring, pricing, or borrowing decision this fall.
Sentiment Has Never Called a Recession. Margins Almost Always Have.
Start with the puzzle. Corporate profits are at record highs, credit spreads are near the very bottom of their historical range, and the stock market is trading above both its 50-day and 200-day moving averages in what technicians call a confirmed uptrend. Institutional money is flowing hard into Technology and Communication Services, the sectors where pricing power and operating leverage are strongest, while Utilities, Real Estate, and Consumer Staples are being sold. That is not the rotation pattern of investors bracing for a slowdown. That is investors betting that margins keep widening.
Simultaneously, the humans doing the work are describing something close to misery. Consumer confidence bounced from 49.5 in June to 55.2 in July, a meaningful two-month surge, but 55 is still deeply depressed by any historical standard. Real wages are falling. Gas is at $4.09 nationally. Mortgage rates sit at 6.66%, and almost every homeowner who bought or refinanced in 2020 or 2021 is locked into a 3% rate they will not give up voluntarily, which means housing turnover has frozen and the economy is running with one of its biggest traditional spending engines essentially parked.
Why Both Readings Can Coexist, For a While
The mechanism that holds these two pictures together is the same one that has held them together before. When profits rise faster than compensation, and in Q2 2026, corporate nominal output grew at roughly 10.6% while compensation grew at just 3.7%, the gains concentrate on balance sheets and in financial assets rather than in paychecks. Stock prices go up. Bond yields stay manageable. Lenders feel fine. But the roughly 80% of Americans in non-supervisory production jobs, whose wages buy about 24% more than in 1990 but whose houses and portfolios have not compounded anything like financial assets have, are living the consumption side of that math. They feel the $4 gas. They feel the grocery bill. They are not wrong about their own lives.
This is the Paycheck Gap made visible in real time. Pay rose. Assets rose very much faster. Only some households own enough assets to feel the asset side. Everyone fills their tank.
What the Historical Record Actually Shows
Here is where the analysis gets useful. We went back through every comparable month since the 1950s and asked a simple question: when consumer sentiment is this depressed, what actually followed? The answer is striking. From readings this low, a recession began within the following twelve months almost never, the base rate is essentially zero. Gloomy households do not cause recessions. They are a lagging symptom of past pain, not a leading cause of future contraction.
Profit margins tell a different story. Margins lead. When corporate margins are expanding, as they are now, reaching 12.9% of GDP, businesses hire more, invest more, and bid up asset prices. When margins compress, those flows reverse, and employment and stock prices follow six to twelve months later. The sequence is almost always in that order: margins turn first, then hiring, then spending, then sentiment.
Right now, margins are at record levels and still expanding. That is the single most constructive data point in the current picture, and it is the one most people outside of corporate finance are not paying attention to.
Where the Honest Risk Lives
This constructive picture has two real friction points worth naming.
First, core inflation remains very high by historical standards, hotter than nine out of every ten months on record. The Fed funds rate sits at 3.5% to 3.75%, which sounds restrictive until you note that the nominal economy is growing above 5%. When borrowing costs are running below nominal growth, the brake is not fully engaged. The Fed has limited room to cut without reigniting inflation, and limited room to hike without risking the margin expansion that is holding the picture together. That is a genuinely tight corner.
Second, long-term interest rates at 4.67% are historically elevated. We checked: from similar rate environments, a new recession began within twelve months about 19% of the time. That is one-in-five. Not the expected outcome, but historically large enough that anyone with refinancing needs in the next one to three years should factor it into their planning rather than assume the current calm is permanent.
What would change the constructive read? Watch unit labor costs. If wages accelerate faster than productivity, meaning companies have to pay more for the same output, margins compress. That is the warning sign. Until it shows up in the data, the profits story is the dominant signal.
Depressed consumer sentiment has never reliably predicted a recession; record profit margins, which are the actual leading indicator, are still expanding, and that distinction is the most important thing to understand about this economy right now.
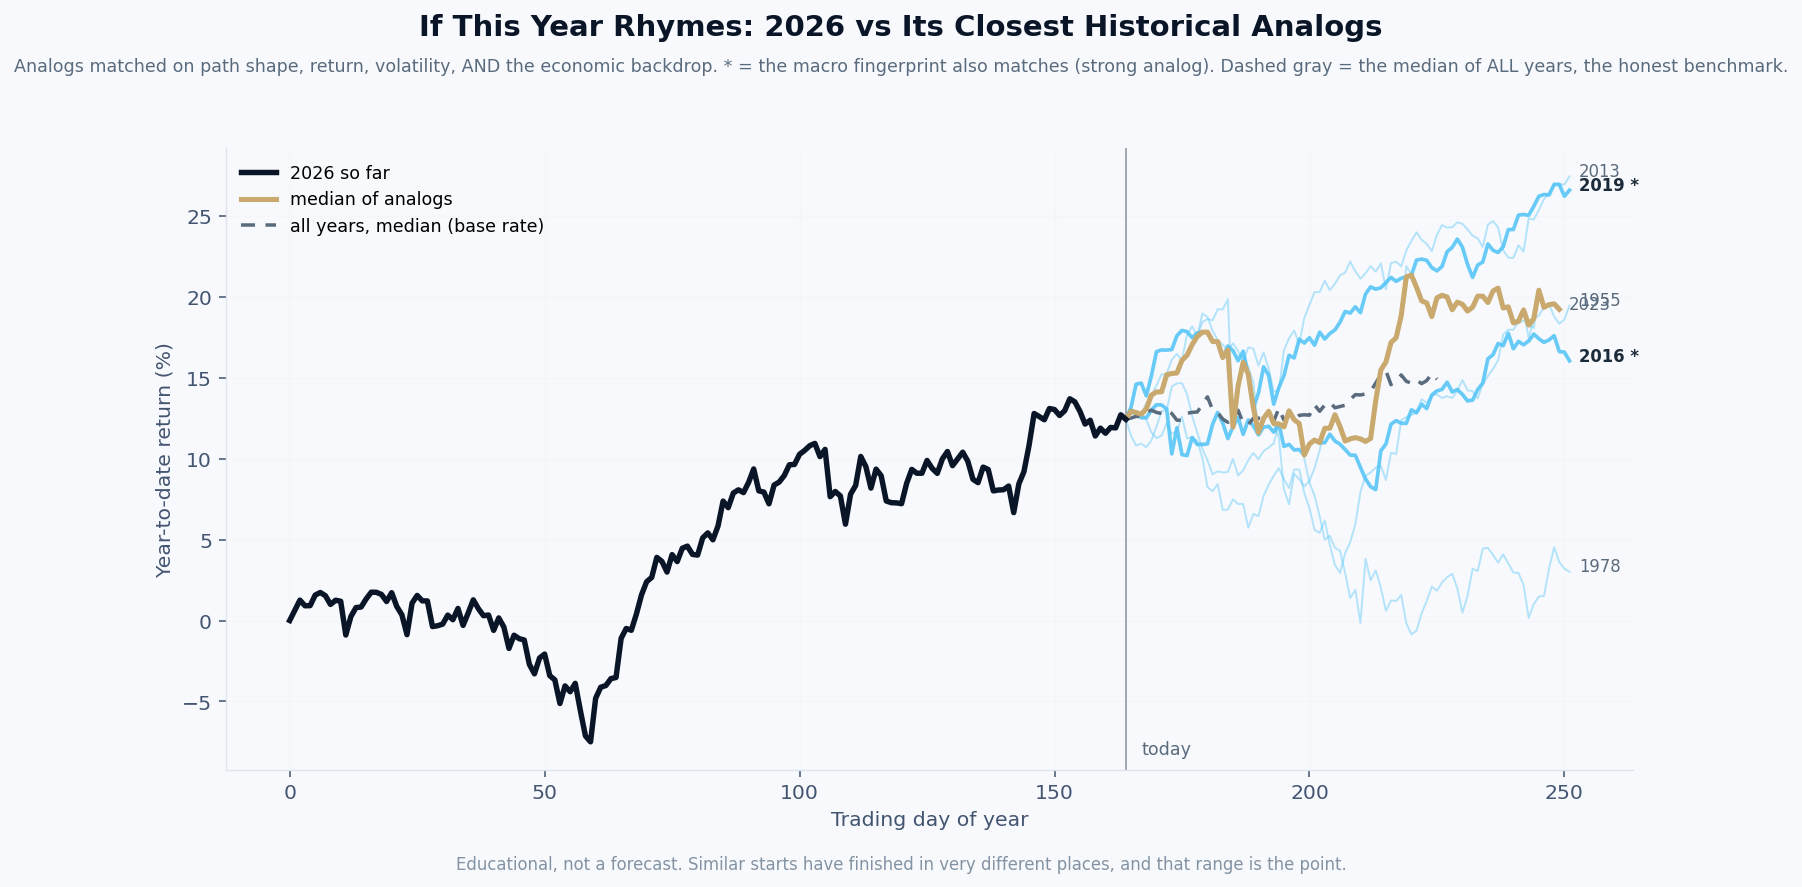
By this week's economic fingerprint, 2026 most closely resembles 1978, then 2013.
What it is. The black line is this year’s market path so far. Each colored line is a past year that our model ranks among the most similar to this one, matched on the shape of the path, its volatility, and the economic backdrop: inflation, interest rates, credit, employment, and more. A star means the economic fingerprint matches especially closely.
How it is built. Rebuilt every week from seventy years of data, using only information that was actually available at each point in history. The years are ranked by the model, not chosen by us.
What it is not. A prediction. Our own testing shows this tool has no ability to forecast where the market finishes the year, and we publish that finding on purpose. What it offers is context: the range of what followed similar setups, so a decision maker can plan for a range instead of betting on a point. The spread between those lines is usually the real lesson.
| Tue | ISM Manufacturing Index for August: a reading above 50 would confirm the business investment story and support the margins-expanding thesis; a miss would raise questions about whether AI-driven capex is broad enough to lift the whole sector. |
| Wed | ADP Private Payrolls for August: a strong print would close some of the gap between buoyant corporate profits and still-depressed worker sentiment, while a soft one would deepen it. |
| Thu | Initial Jobless Claims for the week ending August 29: claims at 203,000 last week were the second-lowest reading of the year, so any meaningful rise would be the first real crack in the labor market story we have been tracking. |
| Fri | August Nonfarm Payrolls and Average Hourly Earnings: the earnings number matters more than the headline count this month, if real wages turn positive again, the sentiment-versus-margins gap starts closing from the bottom up, which is the healthiest resolution. |
Free Research
The economy moves fast. We make sure you move faster.
Economic data, policy shifts, and market signals — delivered to your inbox.
Subscribe Free