
The Fed’s Favorite Inflation Gauge Just Did Something It Hasn’t Done in Years
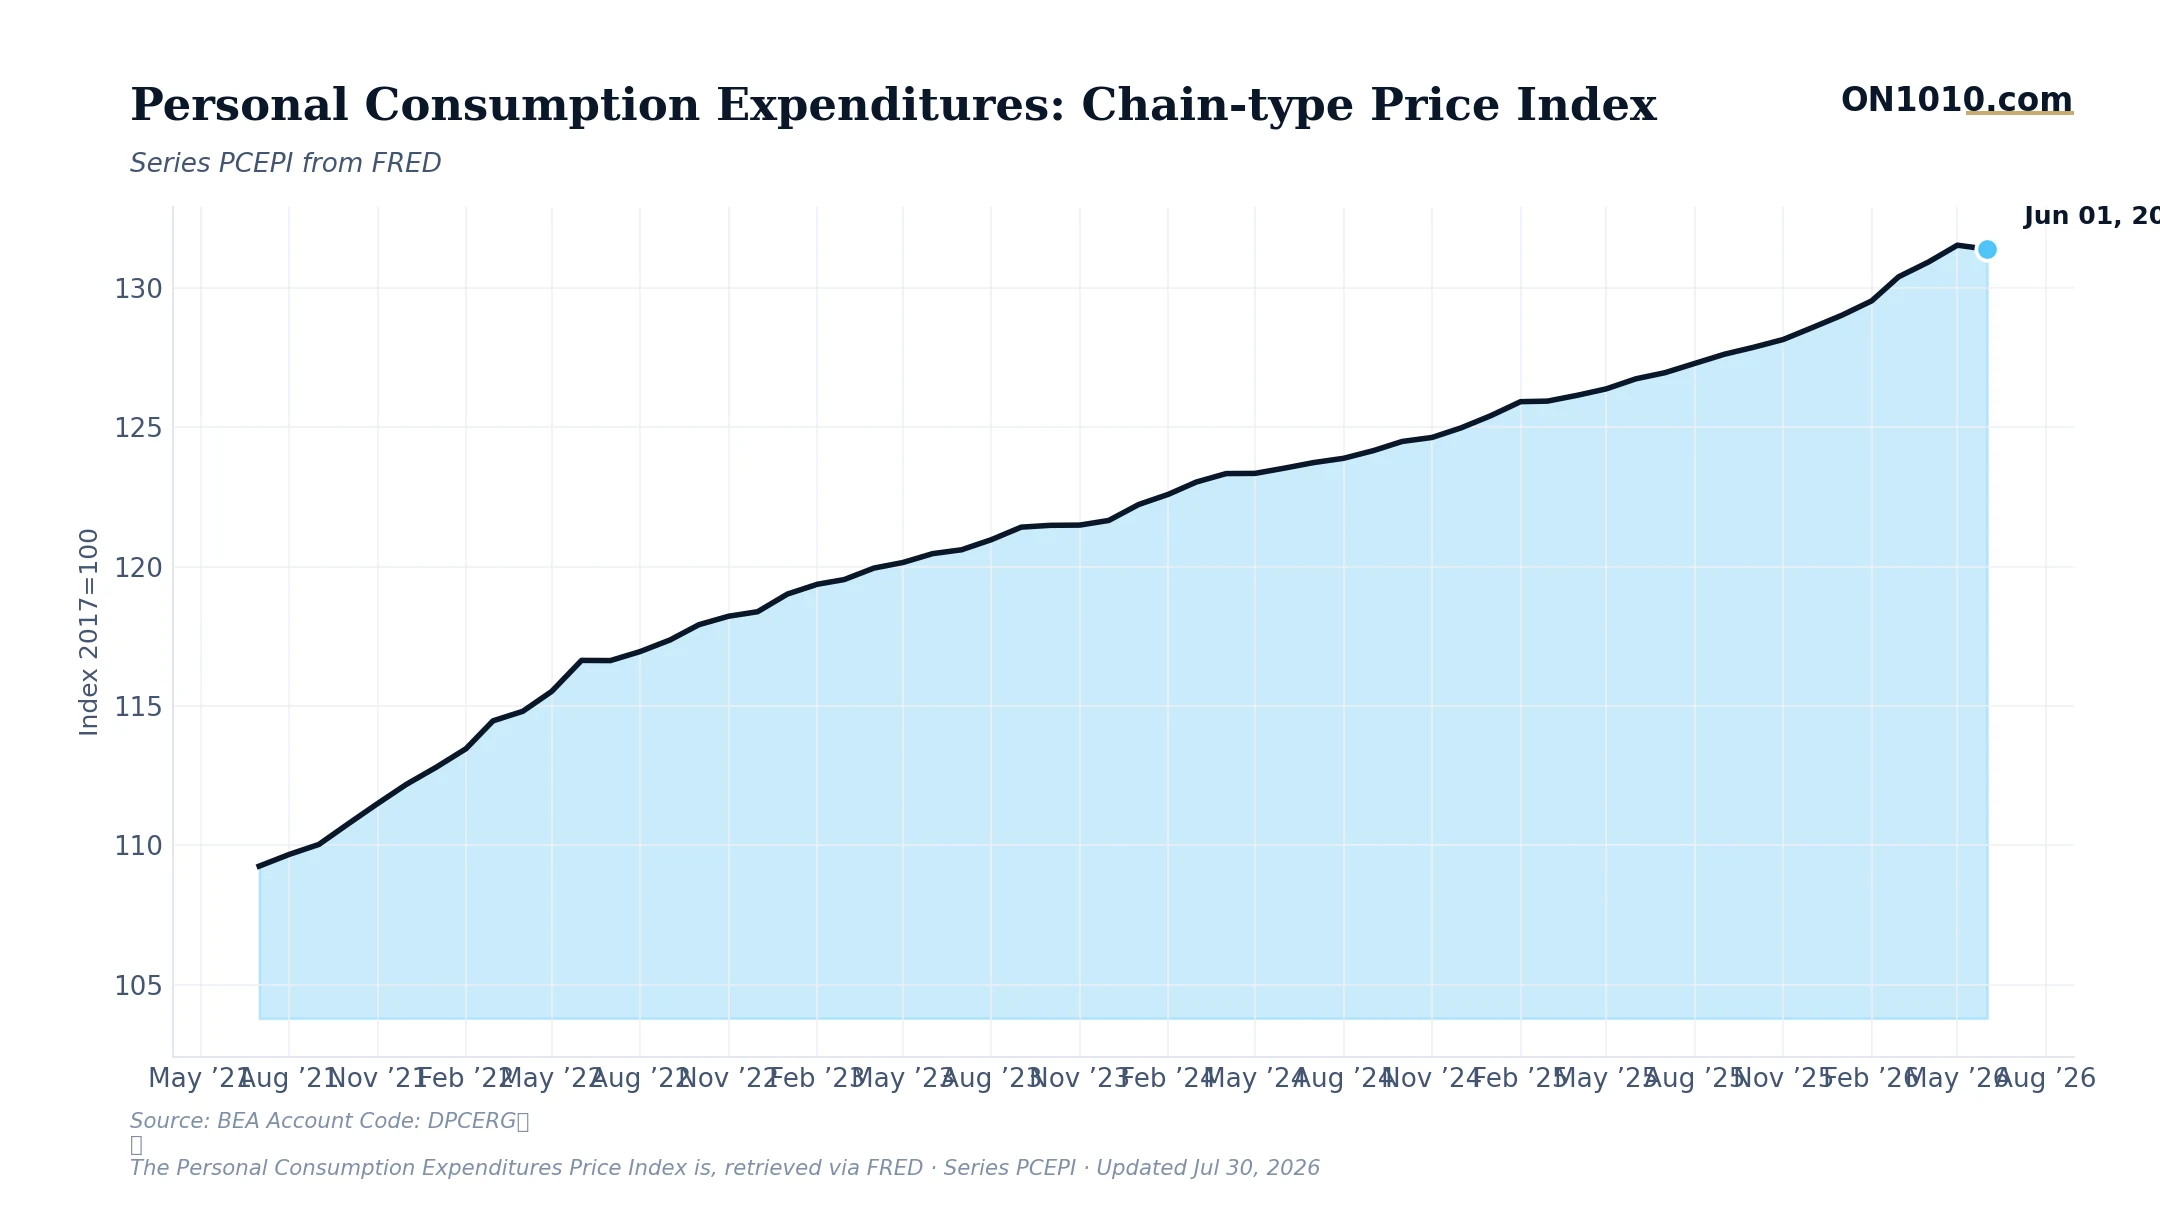
The PCE price index fell in June. Month over month, prices dropped 0.11%, the first monthly decline in recent memory. The headline number sounds like a win, but the year-over-year rate sits at 3.22%, still well above the Fed’s 2% target. That gap is the whole story.
Six months of data tells you exactly what’s happening. The PCE index ran from 129.0 in January to a peak of 131.5 in May, then pulled back slightly in June. Prices accelerated sharply through the first half of the year, and one month of softness doesn’t erase that. The inflation gauge sits at the 92nd percentile of its own historical range, meaning it has been this hot only about 8% of the time in the entire data series. That’s not a rounding error, it’s a structural problem.
Here’s the tension worth sitting with. Growth is neutral (47th percentile) and drifting lower. Consumer sentiment is at its weakest reading in the entire historical record. Credit spreads are tight, which signals calm in the credit markets. But inflation is running hot and interest rates remain elevated at the 71st percentile historically. That combination, slowing growth, exhausted consumers, high rates, and sticky prices, is the hardest environment for policymakers to navigate, because the usual cure for each problem makes the others worse.
In past cycles, when inflation held above 3% year over year while growth was softening, the question businesses watched most closely was what happened to unit labor costs relative to prices. If wages were rising faster than companies could pass costs along, margins compressed. Historically, that sequence tends to precede reduced hiring and investment. The question worth tracking now: are the businesses in your sector maintaining pricing power, or are cost pressures starting to squeeze?
Bottom Line: One month of falling prices is a data point, not a trend. Inflation is still running at more than 1.5 times the Fed’s target, and the economy doesn’t yet have the productivity growth needed to make that painless. Watch whether June’s dip repeats, that’s when the story changes.
Source: Federal Reserve Economic Data (FRED)
ON1010 Research is an independent publisher of economic education and is not a registered investment adviser, broker-dealer, or investment company. This content is for educational and informational purposes only and is not investment advice or a recommendation to buy, sell, or hold any security. Published under the publisher exemption recognized by Section 202(a)(11)(D) of the Investment Advisers Act of 1940 (Lowe v. SEC). Always consult a qualified financial professional before making any financial decision.
Free Research
The economy moves fast. We make sure you move faster.
Economic data, policy shifts, and market signals — delivered to your inbox.
Subscribe Free