
The Yield Curve Is Positive Again. That’s Not as Simple as It Sounds.
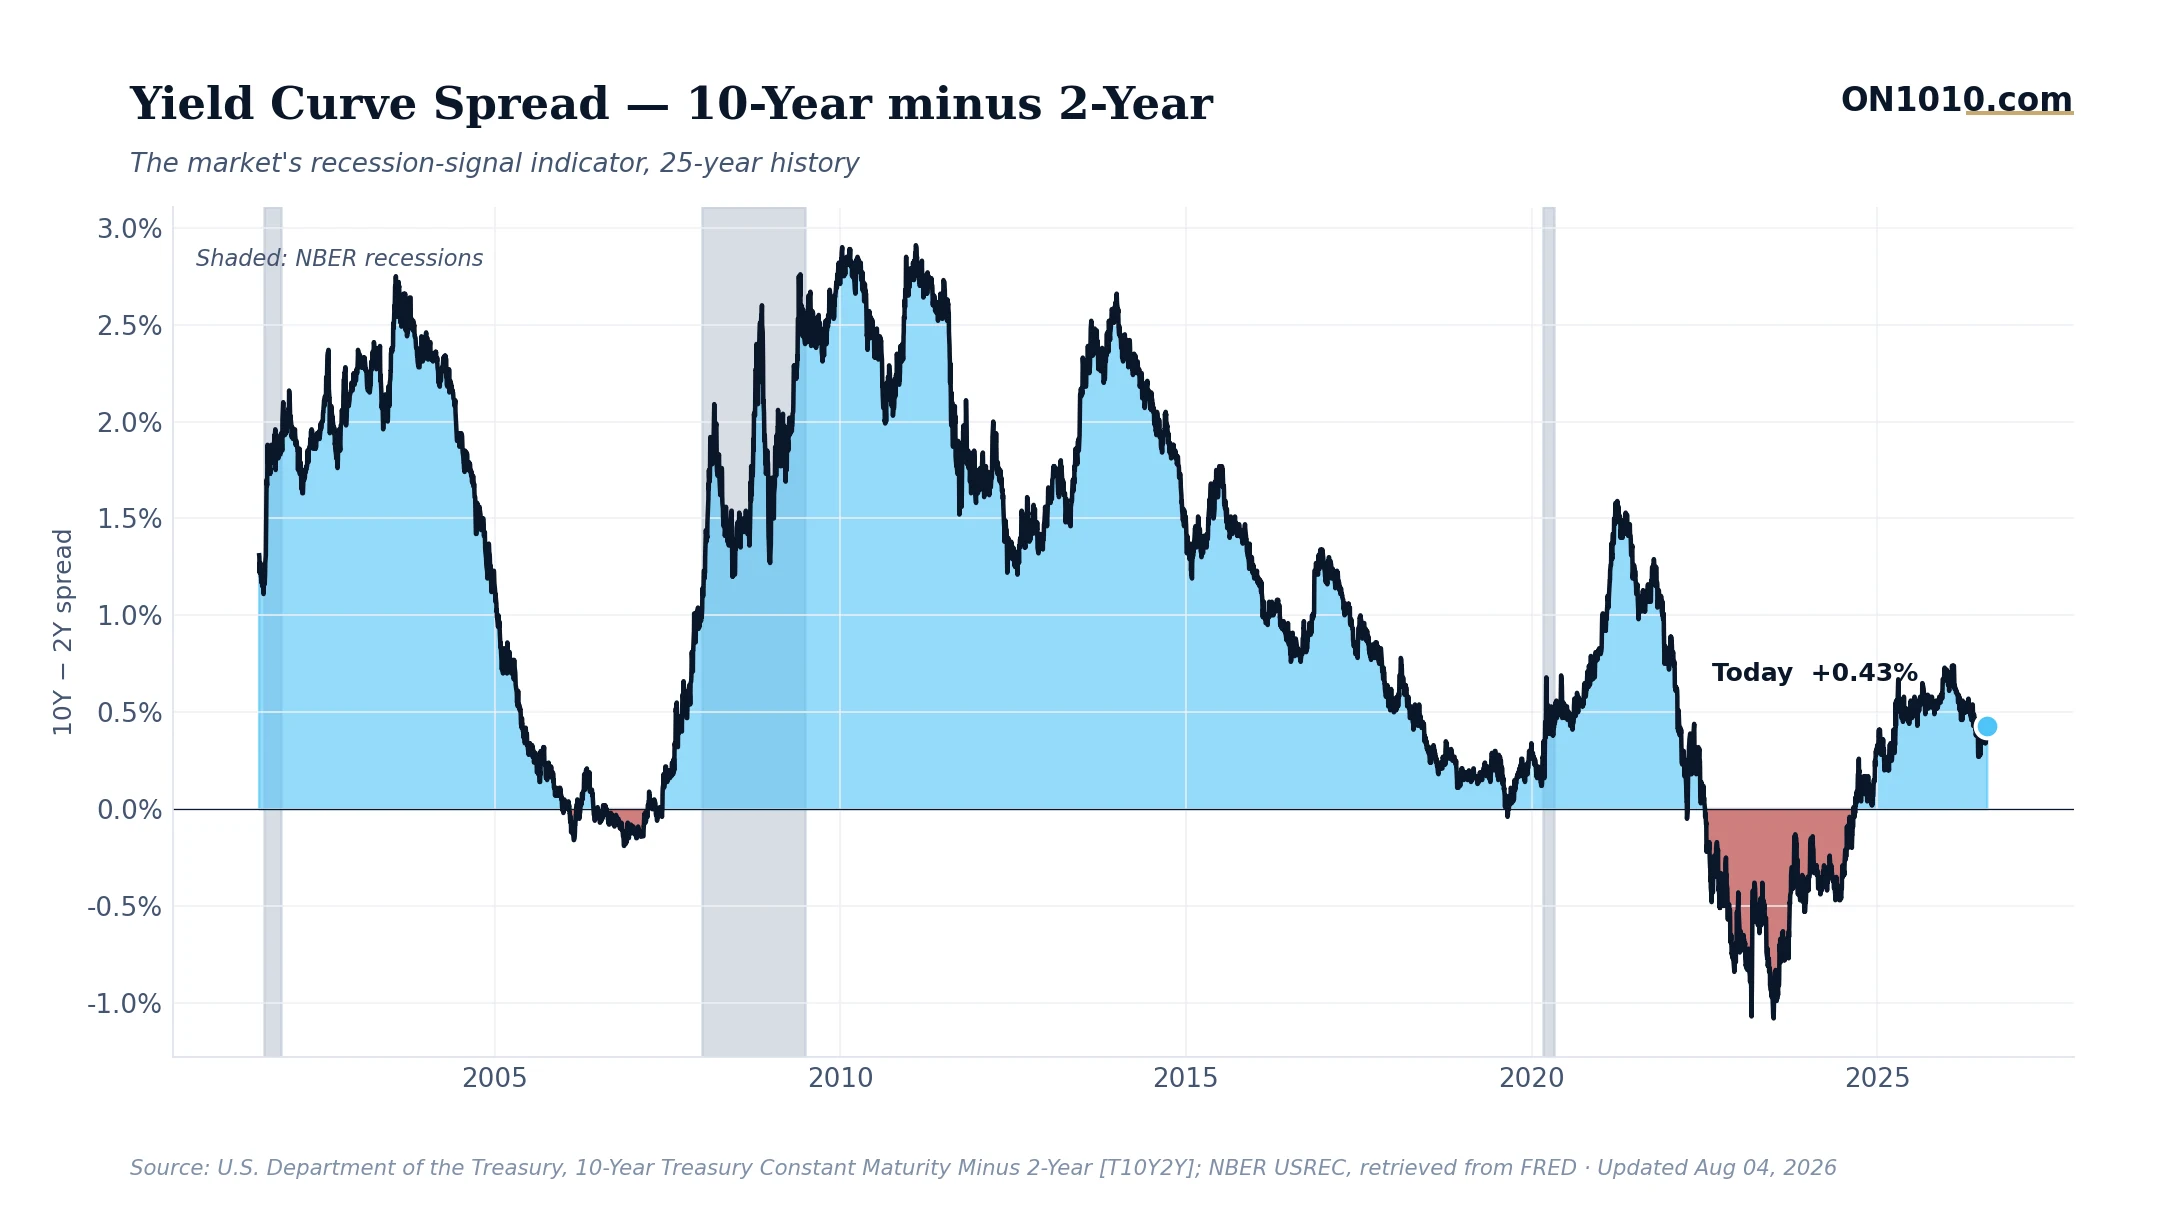
The 10-year/2-year Treasury spread sits at 0.43% as of August 4, narrowing slightly from 0.45% the day before. That small move is less interesting than where we are in the bigger story: the curve has been positive for a while now, and most people still instinctively think of yield curve inversion as the bogeyman. The bogeyman already left. The question is what comes next.
Here’s the puzzle. The curve uninverted, which historically marks the beginning of a more dangerous phase, not a safe one. In past cycles, the re-steepening after inversion often preceded recessions by six to eighteen months. The inversion wasn’t the warning shot. The return to positive was. That’s because long rates rise relative to short rates when markets start pricing in either faster growth, more inflation, or both. Understanding which one is doing the work matters enormously right now.
The dashboard sharpens the picture. Core inflation sits higher than roughly nine of every ten months in the historical record. Long-term rates are elevated versus history. Credit spreads are tight, suggesting corporate borrowers face no acute stress. Consumer sentiment is near historic lows, yet equity markets are stretched above their own trend. These four things don’t all point the same direction, which is exactly why a 0.43% spread deserves more than a quick glance.
Historically, when the curve returns to positive territory after a prolonged inversion, businesses and capital allocators have watched the slope’s rate of change closely: steepening fast tends to reflect growth expectations, while steepening slowly (as we’re seeing here, edging up from 0.35% just a week ago on July 28 to 0.43% now) can reflect a more cautious repricing. In past cycles, operators with refinancing needs or long-duration capital commitments have treated this window as a moment to revisit their assumptions about where rates settle. That decision belongs with a qualified financial professional who knows your specific balance sheet.
Bottom Line: The curve is back in positive territory, but the historical base rate reminds us that the transition period after inversion is when surprises tend to show up. What kind of re-steepening is this, growth-led or something more complicated?
Source: Federal Reserve Economic Data (FRED)
ON1010 Research is an independent publisher of economic education and is not a registered investment adviser, broker-dealer, or investment company. This content is for educational and informational purposes only and is not investment advice or a recommendation to buy, sell, or hold any security. Published under the publisher exemption recognized by Section 202(a)(11)(D) of the Investment Advisers Act of 1940 (Lowe v. SEC). Always consult a qualified financial professional before making any financial decision.
Free Research
The economy moves fast. We make sure you move faster.
Economic data, policy shifts, and market signals — delivered to your inbox.
Subscribe Free