
The Yield Curve Keeps Sending the “All Clear”, But Here’s What That Really Means
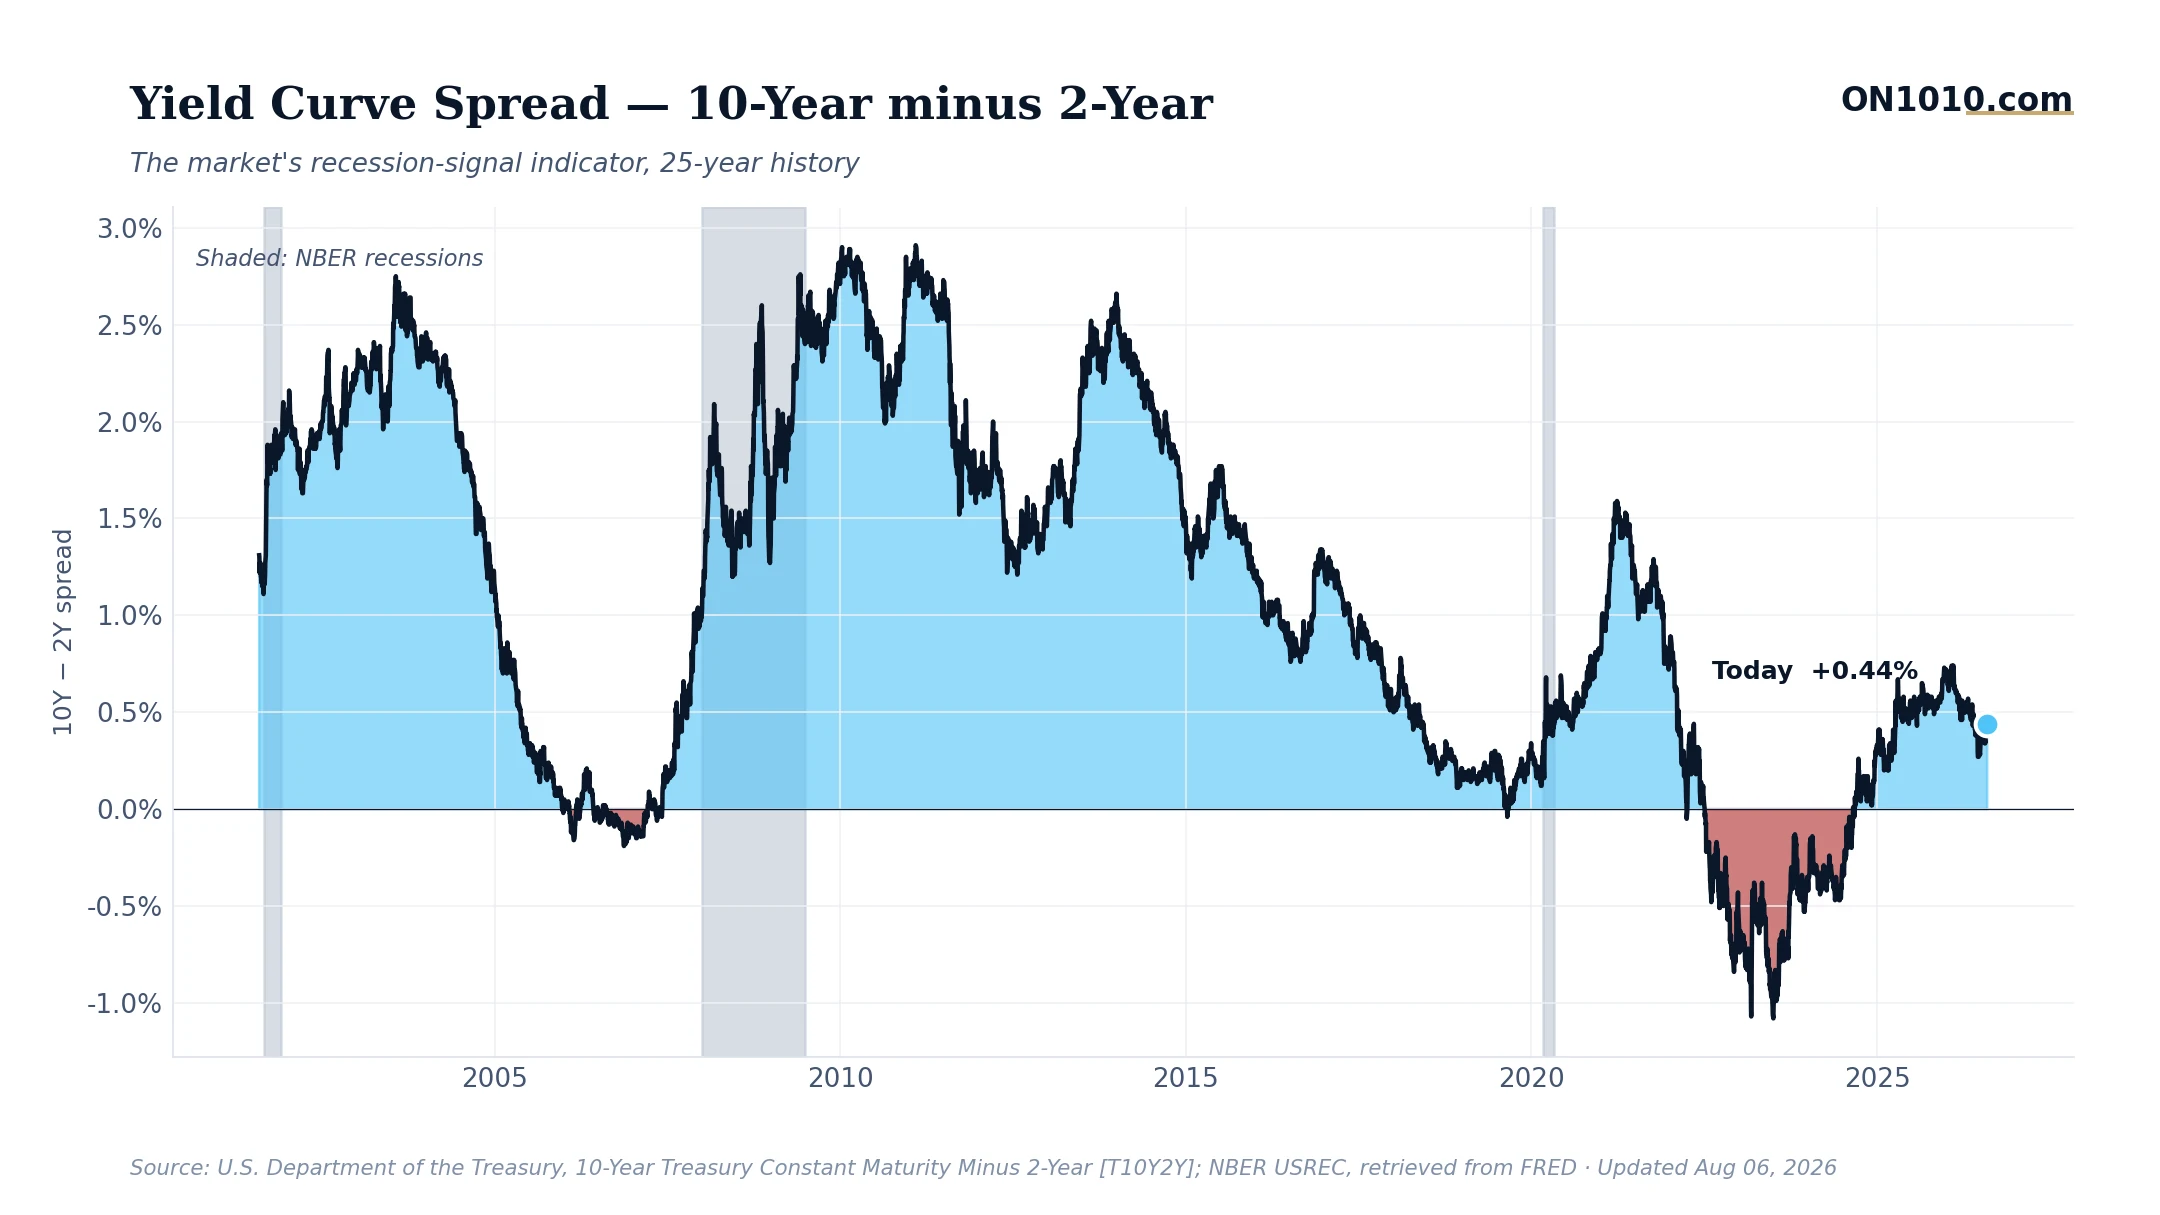
The 10-year/2-year Treasury spread held steady at 0.44% on August 6, barely a whisper from the prior day’s 0.45%. The number itself is quiet. The story it tells is not.
A year ago, this spread was deeply negative. Today it’s positive and stable. The bond market has, in a measured and deliberate way, walked back its recession warning. That’s worth pausing on.
The yield curve’s return to positive territory reflects a specific bet embedded in bond prices: that the Federal Reserve’s rate-cutting path has room to run, and that the economy isn’t about to fall off a cliff. When short-term rates (the 2-year, which tracks Fed policy closely) are lower than long-term rates (the 10-year, which reflects long-run growth and inflation expectations), the curve is telling you that markets expect easier money ahead without expecting a hard economic landing. The broader gauge picture supports this read. Credit spreads are historically tight, signaling calm in corporate debt markets. Equity volatility has dropped to low territory by historical standards. Those aren’t the fingerprints of a market pricing in distress.
But this is also where intellectual honesty matters. Core inflation sits historically high, and long-term interest rates remain elevated by historical norms. A positive spread in a still-expensive rate environment carries different weight than a positive spread in a low-rate era. Historically, when long-term rates were elevated like this, a new recession began within the following 12 months about 19% of the time. That’s a minority outcome, but it’s not trivial. In past cycles, business leaders and capital allocators have used a re-steepening curve to evaluate refinancing windows, capital project timelines, and the cost of carrying variable-rate debt.
Bottom Line: The yield curve no longer says recession is coming, but it’s whispering something more subtle: conditions are improving, costs remain high, and the window between “better” and “easy” is where most of the interesting decisions get made.
Source: Federal Reserve Economic Data (FRED)
ON1010 Research is an independent publisher of economic education and is not a registered investment adviser, broker-dealer, or investment company. This content is for educational and informational purposes only and is not investment advice or a recommendation to buy, sell, or hold any security. Published under the publisher exemption recognized by Section 202(a)(11)(D) of the Investment Advisers Act of 1940 (Lowe v. SEC). Always consult a qualified financial professional before making any financial decision.
Free Research
The economy moves fast. We make sure you move faster.
Economic data, policy shifts, and market signals — delivered to your inbox.
Subscribe Free