
The Yield Curve Is Positive Again. That’s the Good News. Here’s the Complicated Part.
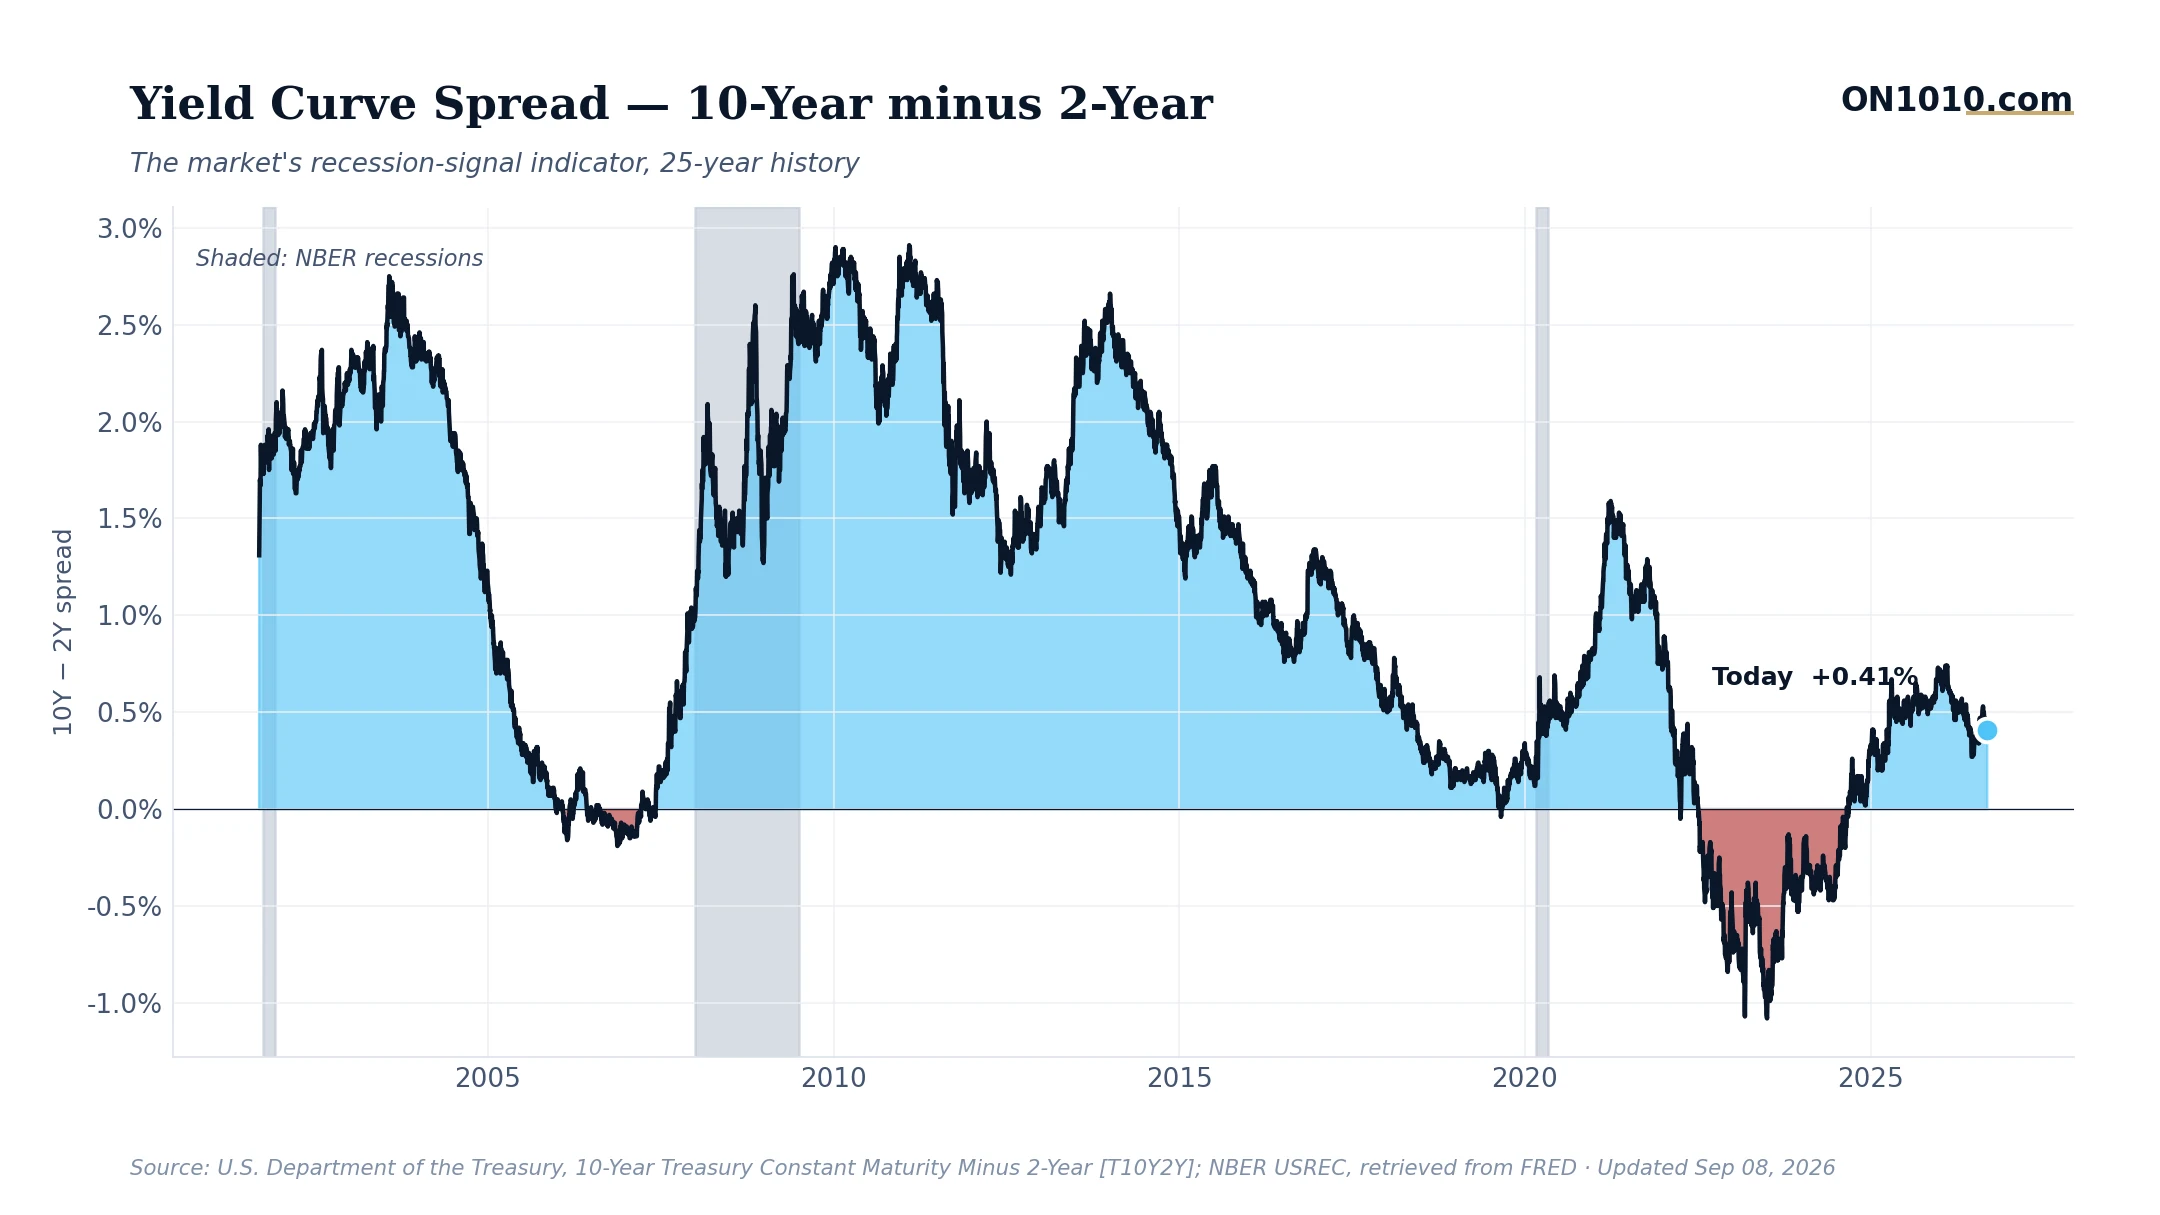
The 10-year/2-year Treasury spread has been sitting at 0.41% for two consecutive readings, holding steady after a small dip to 0.40% earlier in the week. The curve is positive, which means lenders are being paid more to hold long-term debt than short-term debt. That’s how it’s supposed to work. The question worth asking: does a normal-looking curve actually mean the coast is clear?
Not automatically. The yield curve spent most of 2022 through 2024 deeply inverted, meaning short-term rates were higher than long-term ones. That inversion is widely watched because it has preceded every U.S. recession since the 1960s. What’s less discussed is the uninversion itself. Historically, the recession clock doesn’t usually start during the inversion. It starts after the curve normalizes, often because the Fed begins cutting rates in response to a weakening economy. The return to positive territory can mark the beginning of the danger zone, not the end of it.
That context matters right now. Interest rates remain elevated by historical standards, inflation is still running hot, and consumer sentiment is unusually weak despite credit markets that look calm. The economy’s gauges are sending mixed signals, and the yield curve’s steadiness at 0.41% doesn’t resolve that tension.
In past cycles, investors and business operators have used the curve’s path after uninversion as a signal to track financing conditions, credit availability, and the likelihood of a growth slowdown materializing. Historically, when long-term rates have been this elevated relative to their own history, a new recession began within the following year roughly 19% of the time. That is not a prediction. It is a base rate worth knowing.
Bottom Line: A positive yield curve looks healthy on the surface, but the more important question is what drove it positive and whether the economy grew into it or the Fed just started cutting. The mechanism behind the number tells the real story.
Source: Federal Reserve Economic Data (FRED)
ON1010 Research is an independent publisher of economic education and is not a registered investment adviser, broker-dealer, or investment company. This content is for educational and informational purposes only and is not investment advice or a recommendation to buy, sell, or hold any security. Published under the publisher exemption recognized by Section 202(a)(11)(D) of the Investment Advisers Act of 1940 (Lowe v. SEC). Always consult a qualified financial professional before making any financial decision.
Free Research
The economy moves fast. We make sure you move faster.
Economic data, policy shifts, and market signals — delivered to your inbox.
Subscribe Free