
The 10-Year Treasury Is Sitting Near Multi-Decade Highs. The Bond Market Is Sending a Signal Worth Hearing.
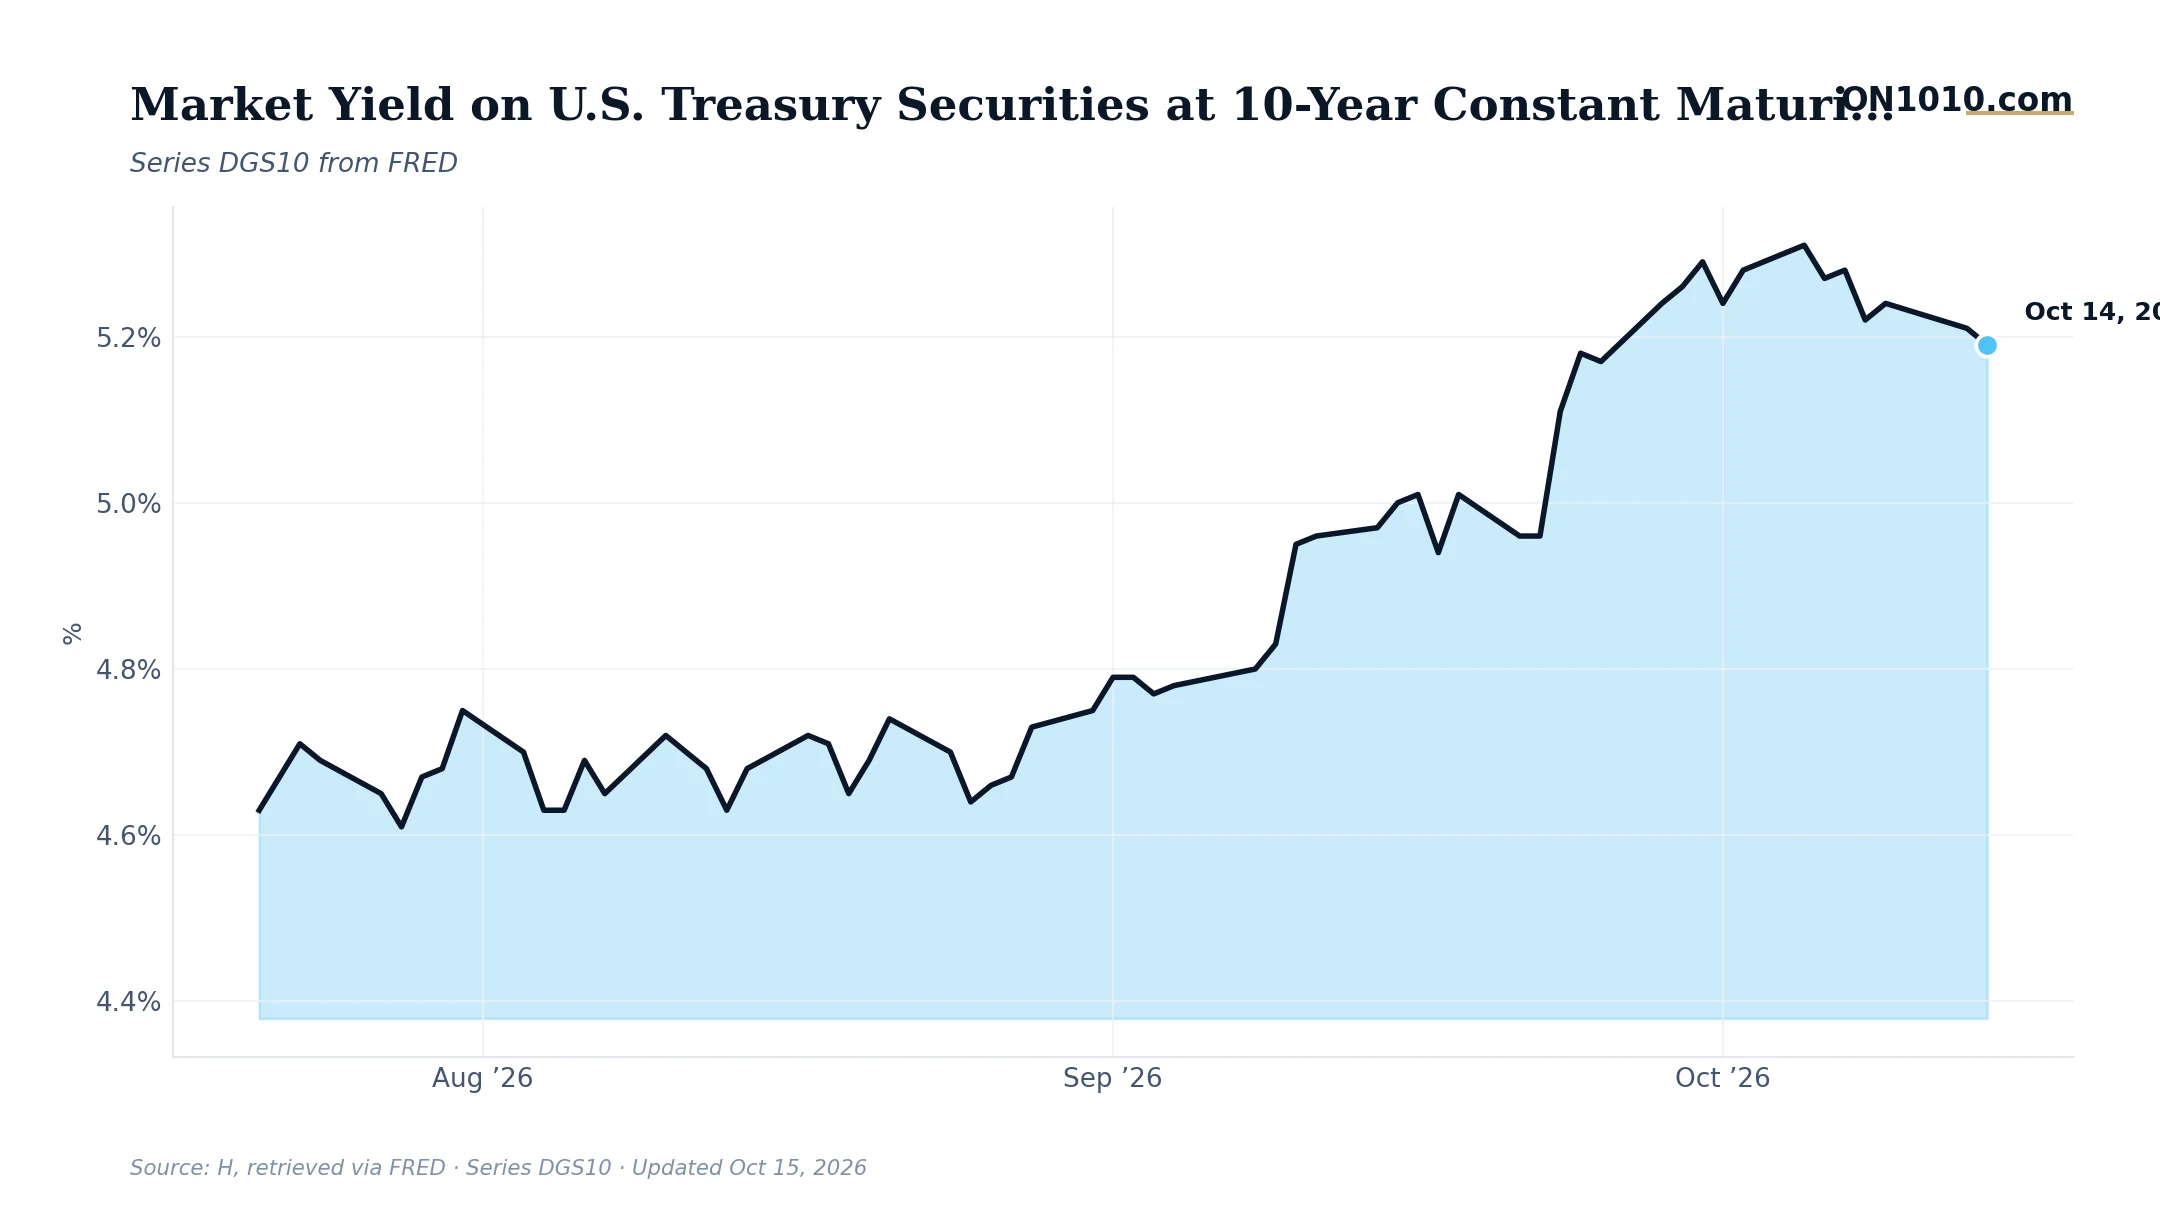
The 10-year Treasury yield edged down to 5.19% on Wednesday, pulling back from a recent high of 5.28% hit just one week ago. The move is small. The level is not.
At 5.19%, the 10-year yield sits in the upper range of its history going back decades. This is not a temporary blip from a volatile week. The yield has been camped above 5.20% for most of the past week, and the broader context makes that more significant, not less: core inflation remains hot relative to its historical norm, the real policy rate (what the Fed charges after subtracting inflation) is restrictive by historical standards, and credit spreads have recently widened from neutral territory into elevated territory. Three stress signals, pointing in the same direction.
Here is the mechanism that makes this matter beyond just bond math. When the 10-year yield runs this high, it sets the floor on borrowing costs across the entire economy. Corporate bond rates price off it. Mortgage rates price off it. The rate businesses use to evaluate whether a new investment pencils out prices off it. Historically, when long-term rates have held at levels like these for sustained periods, capital allocation decisions shift. Projects that looked profitable at a 3% or 4% benchmark rate no longer work at 5%-plus, which gradually chills business investment and margin expansion.
In past cycles, stretches where long-term rates held near the upper range of their historical distribution have eventually resolved lower, though the timing has varied widely and the path has rarely been straight. The question business leaders and capital allocators have historically had to wrestle with in environments like this: how much of current financing, refinancing, or investment planning is being built around rates staying elevated versus rates eventually easing?
Bottom Line: A 2-basis-point daily move is noise. A 10-year yield above 5% for a sustained stretch, layered on top of wide credit spreads and a restrictive real policy rate, is the signal worth watching. How long can borrowing costs stay this high before they start showing up in margins?
Source: Federal Reserve Economic Data (FRED)
ON1010 Research is an independent publisher of economic education and is not a registered investment adviser, broker-dealer, or investment company. This content is for educational and informational purposes only and is not investment advice or a recommendation to buy, sell, or hold any security. Published under the publisher exemption recognized by Section 202(a)(11)(D) of the Investment Advisers Act of 1940 (Lowe v. SEC). Always consult a qualified financial professional before making any financial decision.
Free Research
The economy moves fast. We make sure you move faster.
Economic data, policy shifts, and market signals — delivered to your inbox.
Subscribe Free