
The Yield Curve Just Lost a Third of Its Buffer in Two Weeks
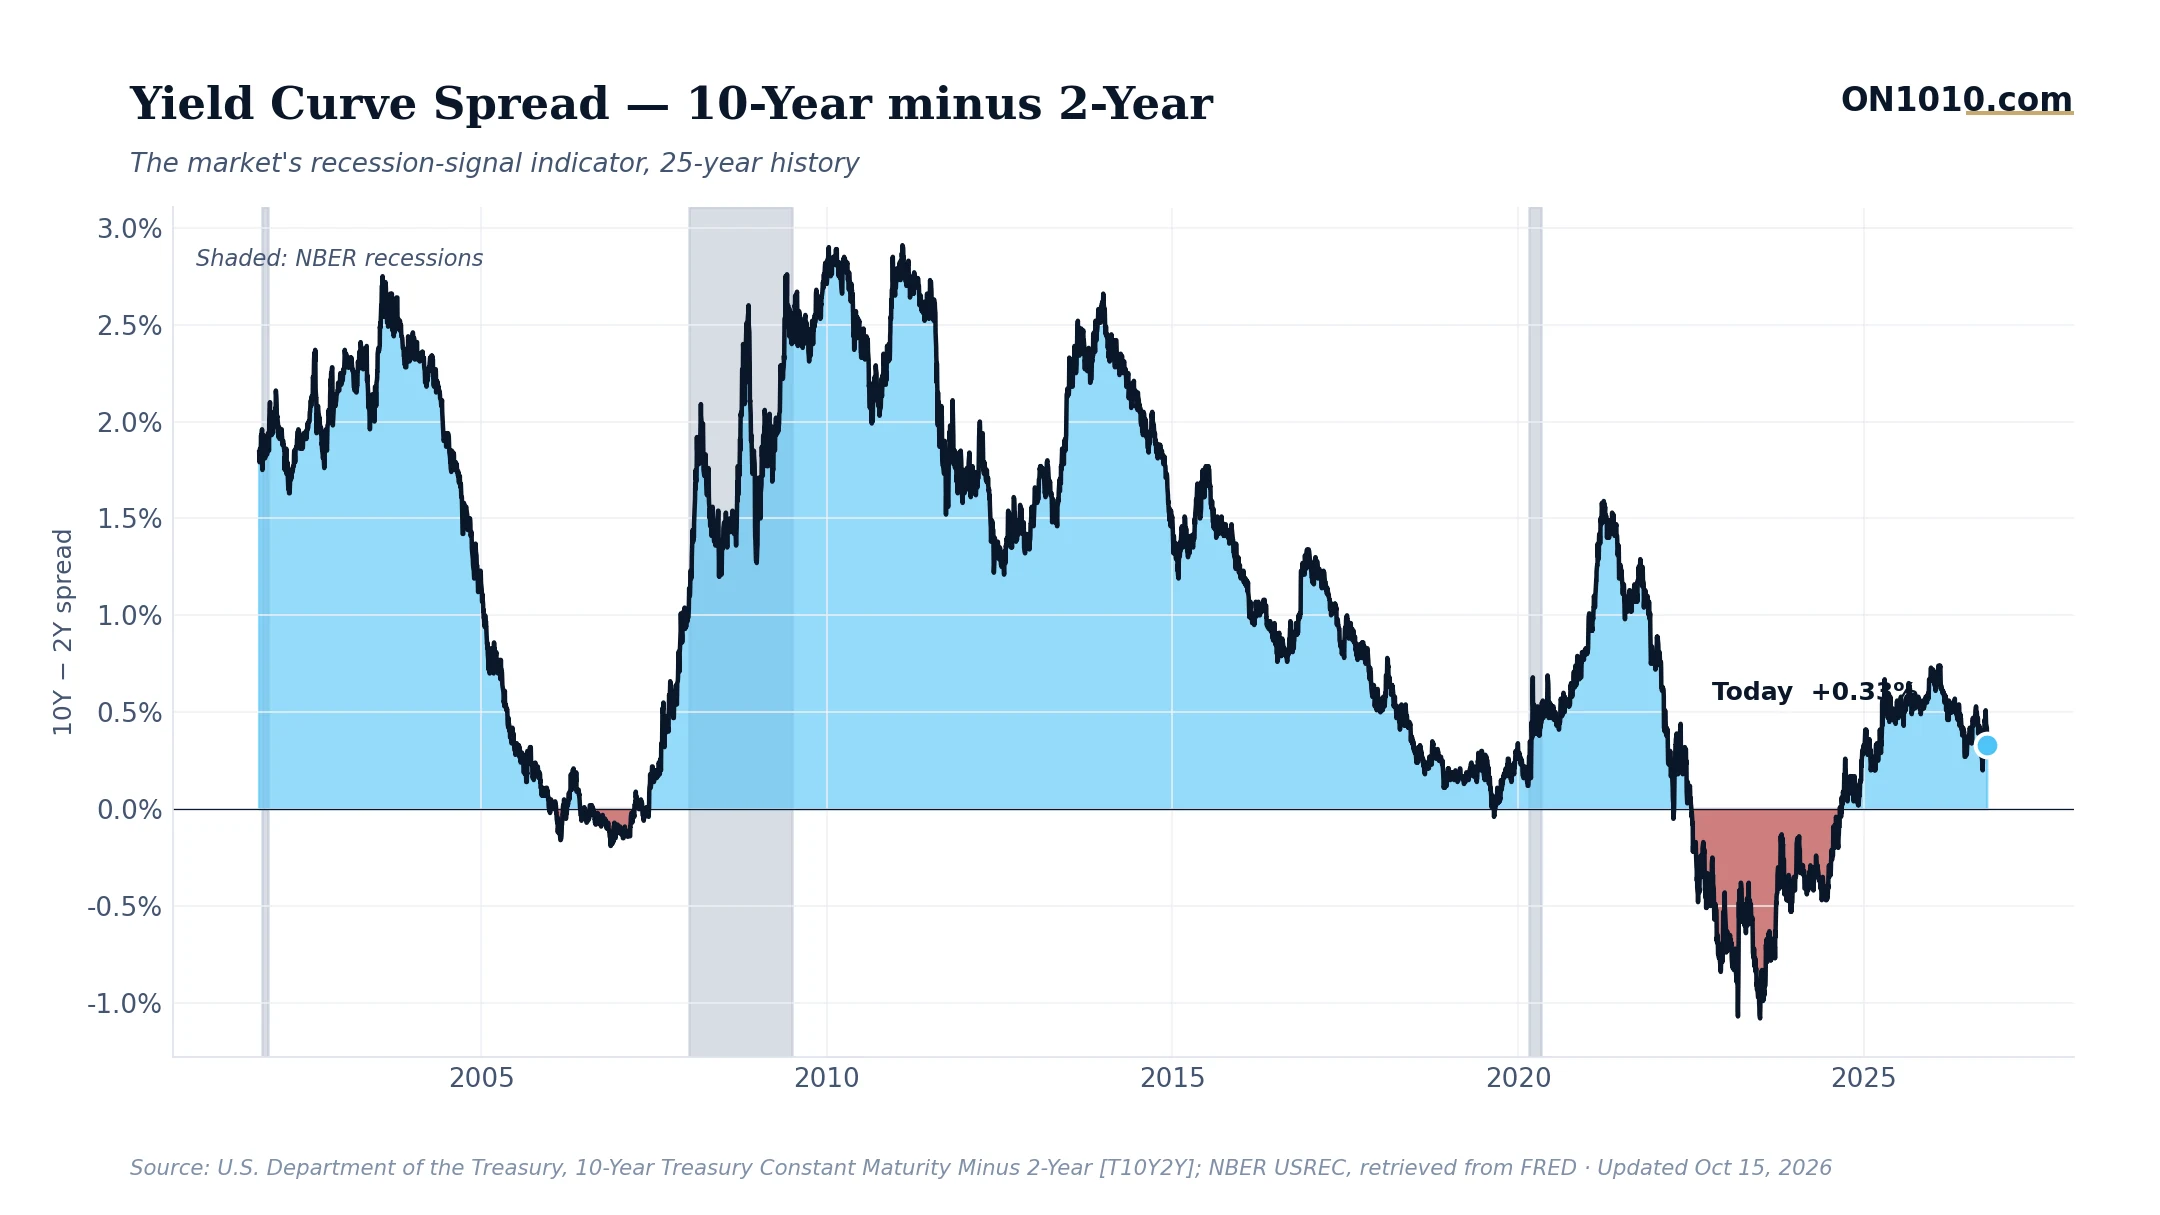
The 10-year/2-year Treasury spread narrowed to 0.33% on October 15, down from 0.51% just eight days ago. That’s a 35% compression in under two weeks, and it’s moving in one direction.
The Bigger Picture
A positive spread means bond markets are still pricing in normal conditions: long-term rates above short-term rates, which is the baseline expectation when growth looks reasonably healthy. But the speed of this move deserves attention. The spread isn’t just drifting lower, it’s sliding. And it’s doing so against a backdrop that makes the direction more meaningful: monetary policy is sitting at a historically restrictive level, long-term interest rates are in the upper range of their historical history, and credit spreads have just widened from neutral to elevated. These aren’t unrelated signals. They’re telling the same story from three different angles.
Consumer sentiment is near the bottom of its historical range. Sector rotation data shows defensive names like health care and consumer staples outperforming, while financials and industrials lag. That’s the kind of quiet repositioning that often precedes a harder economic conversation.
Why It Matters
Historically, a flattening yield curve during a period of restrictive monetary policy has raised questions about whether tighter credit conditions will eventually press on business investment and margins. When borrowing costs stay high and the curve compresses, companies with floating-rate debt or near-term refinancing needs feel it first. In past cycles, investors and capital allocators have used curve flattening as a prompt to revisit duration exposure and stress-test financing assumptions. The historical recession base rate from readings in this monetary policy zone runs around 18% over the following 12 months. Worth knowing. Worth neither dismissing nor overstating.
Bottom Line: The spread itself isn’t alarming yet, but the trajectory, half a percentage point to one-third in two months, is worth watching closely. At what pace does a healthy buffer become a warning?
Source: Federal Reserve Economic Data (FRED)
ON1010 Research is an independent publisher of economic education and is not a registered investment adviser, broker-dealer, or investment company. This content is for educational and informational purposes only and is not investment advice or a recommendation to buy, sell, or hold any security. Published under the publisher exemption recognized by Section 202(a)(11)(D) of the Investment Advisers Act of 1940 (Lowe v. SEC). Always consult a qualified financial professional before making any financial decision.
Free Research
The economy moves fast. We make sure you move faster.
Economic data, policy shifts, and market signals — delivered to your inbox.
Subscribe Free