
The Yield Curve Is Back in Positive Territory. History Says the Real Test Starts Now.
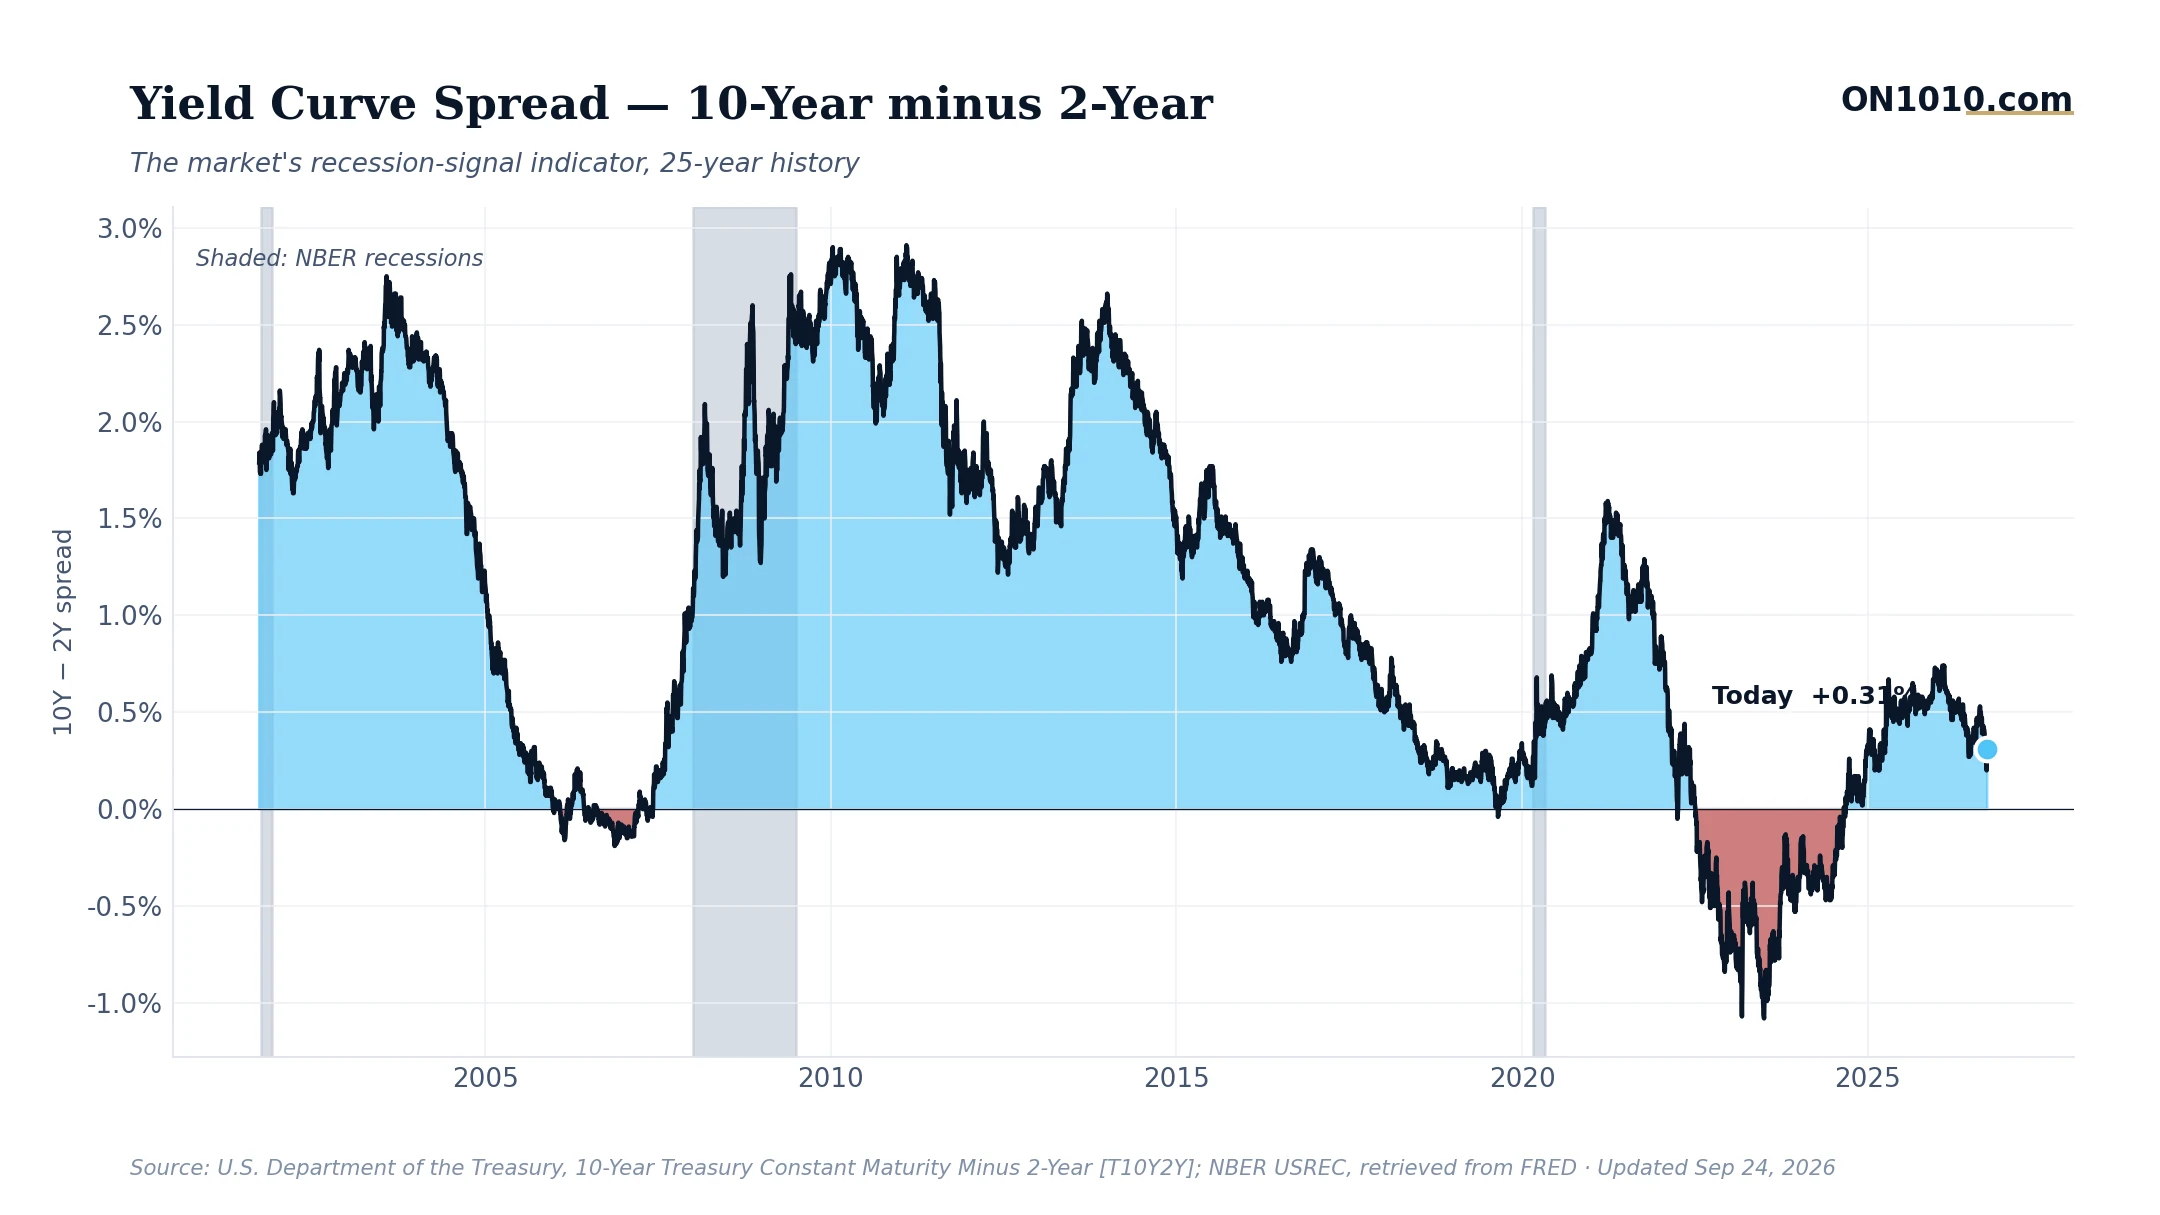
The gap between 10-year and 2-year Treasury yields widened to 0.31% on September 24, up from 0.26% the day before and the highest reading in this recent stretch. After one of the longest yield curve inversions on record, the curve has now been positive for several weeks. That sounds like good news. The history is more complicated.
Here is the tension worth understanding. The yield curve inverts before recessions, and that pattern has an impressive track record. But the recession itself has historically arrived after the curve un-inverts, not during the inversion. The 1990, 2001, and 2008 downturns all began once the curve had already returned to positive territory. The inversion is the warning; the re-steepening is often when the bill comes due.
What drives that pattern? When short-term rates fall faster than long-term rates, it usually means the Fed is cutting because something cracked. Credit conditions today sit near the calmest levels in decades, the stock market is above its key moving averages, and VIX remains subdued. But consumer sentiment is historically weak, long-term interest rates remain historically elevated, and market participation is deteriorating. The economic gauges are not telling one clean story right now.
Historically, when the curve re-steepened from deep inversion, the 12 months that followed ranged widely: sometimes a soft landing, sometimes a recession that arrived with a delay. In past cycles, business operators and capital allocators have watched whether long rates rise (growth optimism pushing yields up) or short rates fall (Fed cutting into weakness) to understand which version of re-steepening is underway. The mechanism matters as much as the direction.
Bottom Line: A positive yield curve is a milestone, not a clearance. The question worth tracking is whether rates are normalizing because the economy earned it, or because the Fed is preparing for something worse.
Source: Federal Reserve Economic Data (FRED)
ON1010 Research is an independent publisher of economic education and is not a registered investment adviser, broker-dealer, or investment company. This content is for educational and informational purposes only and is not investment advice or a recommendation to buy, sell, or hold any security. Published under the publisher exemption recognized by Section 202(a)(11)(D) of the Investment Advisers Act of 1940 (Lowe v. SEC). Always consult a qualified financial professional before making any financial decision.
Free Research
The economy moves fast. We make sure you move faster.
Economic data, policy shifts, and market signals — delivered to your inbox.
Subscribe Free