
The Yield Curve Is Back in Positive Territory. That May Be the Complicated Part.
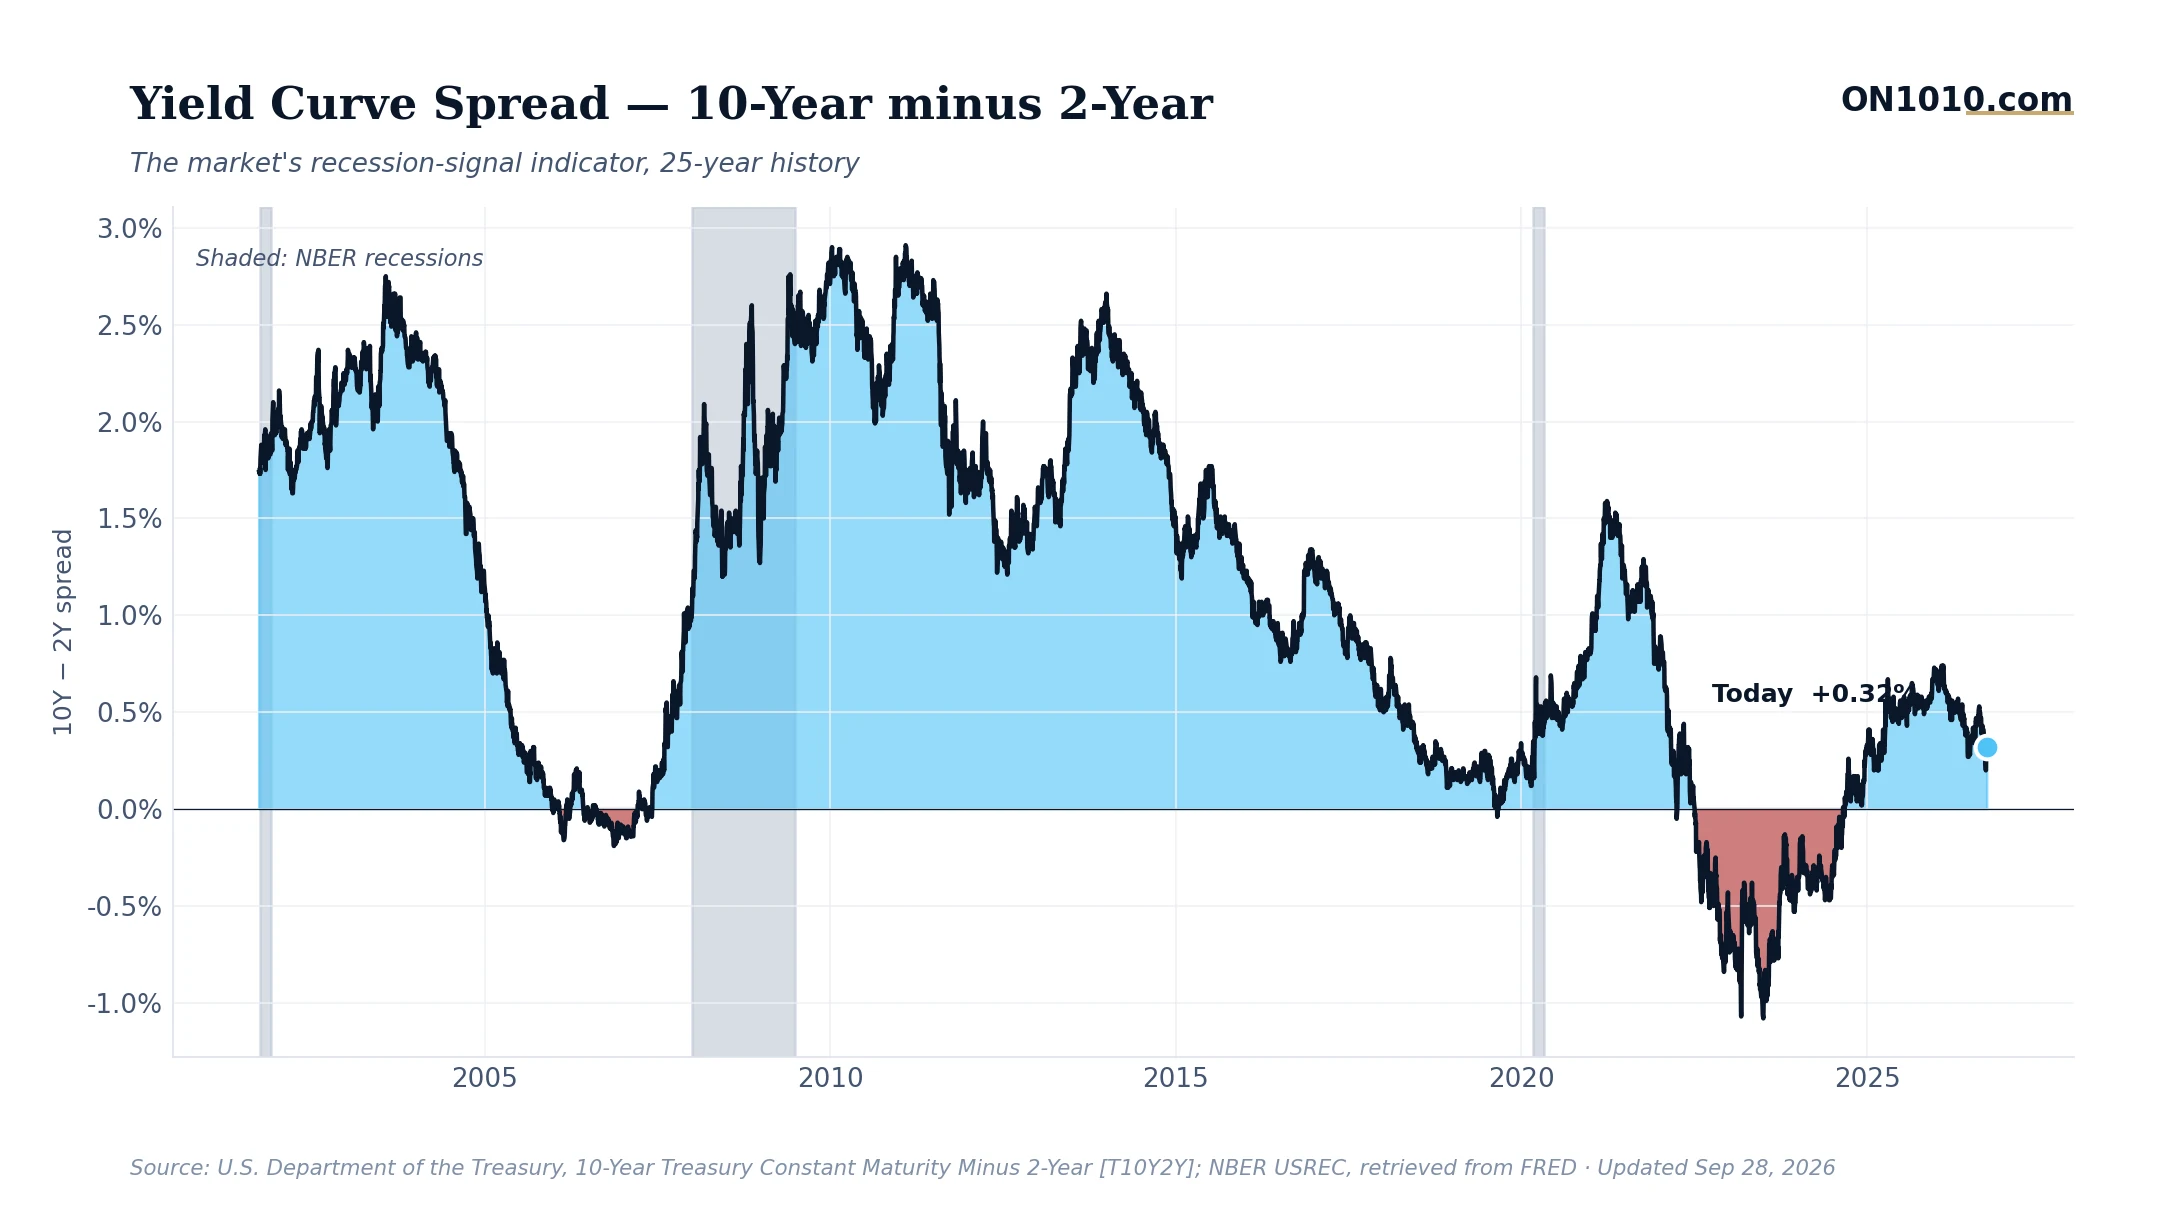
The 10-year minus 2-year Treasury spread sits at 0.32% as of September 28, a slight pullback from 0.36% on Thursday but still firmly positive. The more interesting story is the direction: this spread was just 0.20% a week ago, meaning the curve has steepened meaningfully in a short stretch, then wobbled. The bond market is sending a signal worth decoding.
After spending much of 2022 through 2024 deeply inverted (short-term rates above long-term rates), the curve has quietly normalized. That sounds like good news. It often is. But there is a wrinkle worth understanding: the yield curve frequently un-inverts right before a recession actually arrives, as short-term rates fall faster than long-term ones in anticipation of Federal Reserve cuts. In past cycles, the re-steepening has sometimes been the warning, not the all-clear.
Here is the broader context that makes this reading more complex. Long-term interest rates sit near the upper end of their historical range. Core inflation remains well above its historical norm. Consumer sentiment is near historic lows. Credit spreads, meanwhile, are tight, suggesting corporate credit markets are calm. These signals pull in different directions, which is exactly the kind of mixed environment where single indicators can mislead.
Historically, when the curve normalized from deep inversion into a modest positive spread like this one, the economy was often in a late-cycle phase, with recession odds over the following 12 months running meaningfully higher than the typical base rate. That is a base rate observation, not a forecast. Past performance does not predict future results.
For business operators and capital allocators, the question worth asking is whether long-term borrowing costs embedded in investment decisions reflect a curve that keeps steepening or one that flattens again under renewed Fed pressure.
Bottom Line: A positive yield curve feels like a relief after two-plus years of inversion, but the path to normalization matters as much as the destination. What is driving the steepening tells you more than the spread itself.
Source: Federal Reserve Economic Data (FRED)
ON1010 Research is an independent publisher of economic education and is not a registered investment adviser, broker-dealer, or investment company. This content is for educational and informational purposes only and is not investment advice or a recommendation to buy, sell, or hold any security. Published under the publisher exemption recognized by Section 202(a)(11)(D) of the Investment Advisers Act of 1940 (Lowe v. SEC). Always consult a qualified financial professional before making any financial decision.
Free Research
The economy moves fast. We make sure you move faster.
Economic data, policy shifts, and market signals — delivered to your inbox.
Subscribe Free