
The Yield Curve Is Back in Positive Territory. Here’s Why That’s More Complicated Than It Sounds.
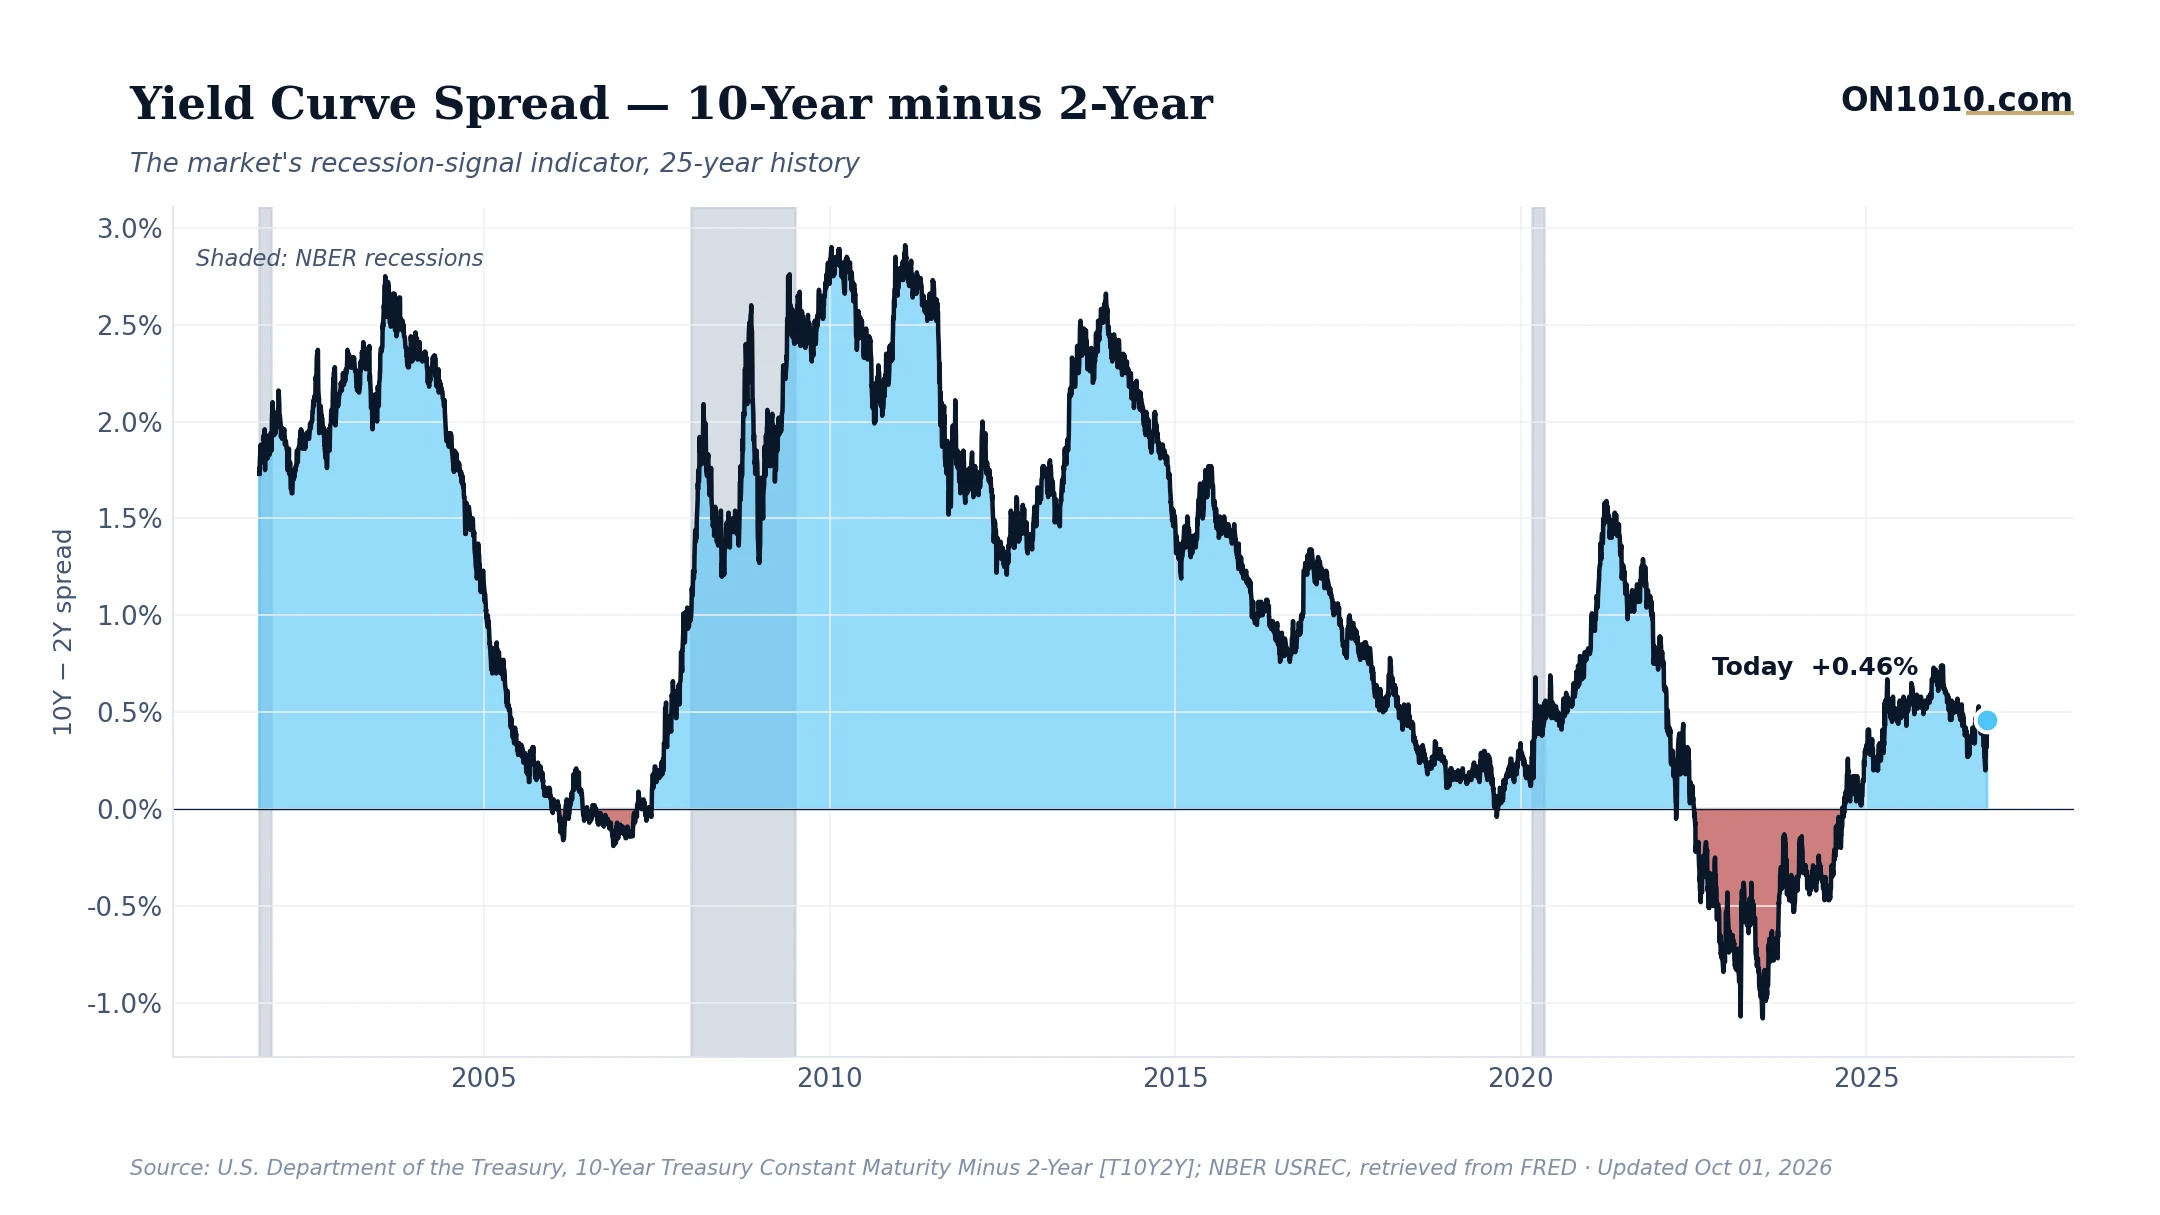
The 10-year minus 2-year Treasury spread widened to 0.46% on October 1, up from 0.41% the day before and continuing a move that has been building all week. The curve has now steepened from 0.31% just a week ago. On the surface, a positive spread looks like good news. The bond market is no longer flashing the recession warning it held for much of the past two years.
But here’s the tension worth understanding: yield curves can “un-invert” for two very different reasons. Either long-term growth optimism pulls long rates higher, or short-term rates fall because the economy is weakening and the Fed is cutting. Historically, it’s the second version that tends to precede the actual economic slowdown, not the inversion itself. The uninversion is when the story often gets interesting.
Right now, the broader economic backdrop adds texture. Monetary policy sits in restrictive territory by historical standards, core inflation remains elevated, and consumer sentiment is near the bottom of its historical range. That combination means the Fed has limited room to ease aggressively without reigniting price pressures, while businesses and households are already feeling the weight of high long-term rates.
In past cycles, investors and business decision-makers have watched yield curve normalization closely because it changes the math on duration and borrowing costs across the economy. Historically, when the curve is positive but interest rates remain in the upper range of their history, credit conditions for long-term projects remain tight even if the headline spread looks healthy. The question worth asking: is this curve steepening because growth expectations are rising, or because markets are beginning to price in policy relief ahead?
Bottom Line: A positive yield curve is a better headline than an inverted one, but the mechanism that got you there matters as much as the number itself. Watch whether this steepening is being driven by the long end rising or the short end falling.
Source: Federal Reserve Economic Data (FRED)
ON1010 Research is an independent publisher of economic education and is not a registered investment adviser, broker-dealer, or investment company. This content is for educational and informational purposes only and is not investment advice or a recommendation to buy, sell, or hold any security. Published under the publisher exemption recognized by Section 202(a)(11)(D) of the Investment Advisers Act of 1940 (Lowe v. SEC). Always consult a qualified financial professional before making any financial decision.
Free Research
The economy moves fast. We make sure you move faster.
Economic data, policy shifts, and market signals — delivered to your inbox.
Subscribe Free