
THE BOND MARKET’S INFLATION BET HAS STOPPED MOVING.
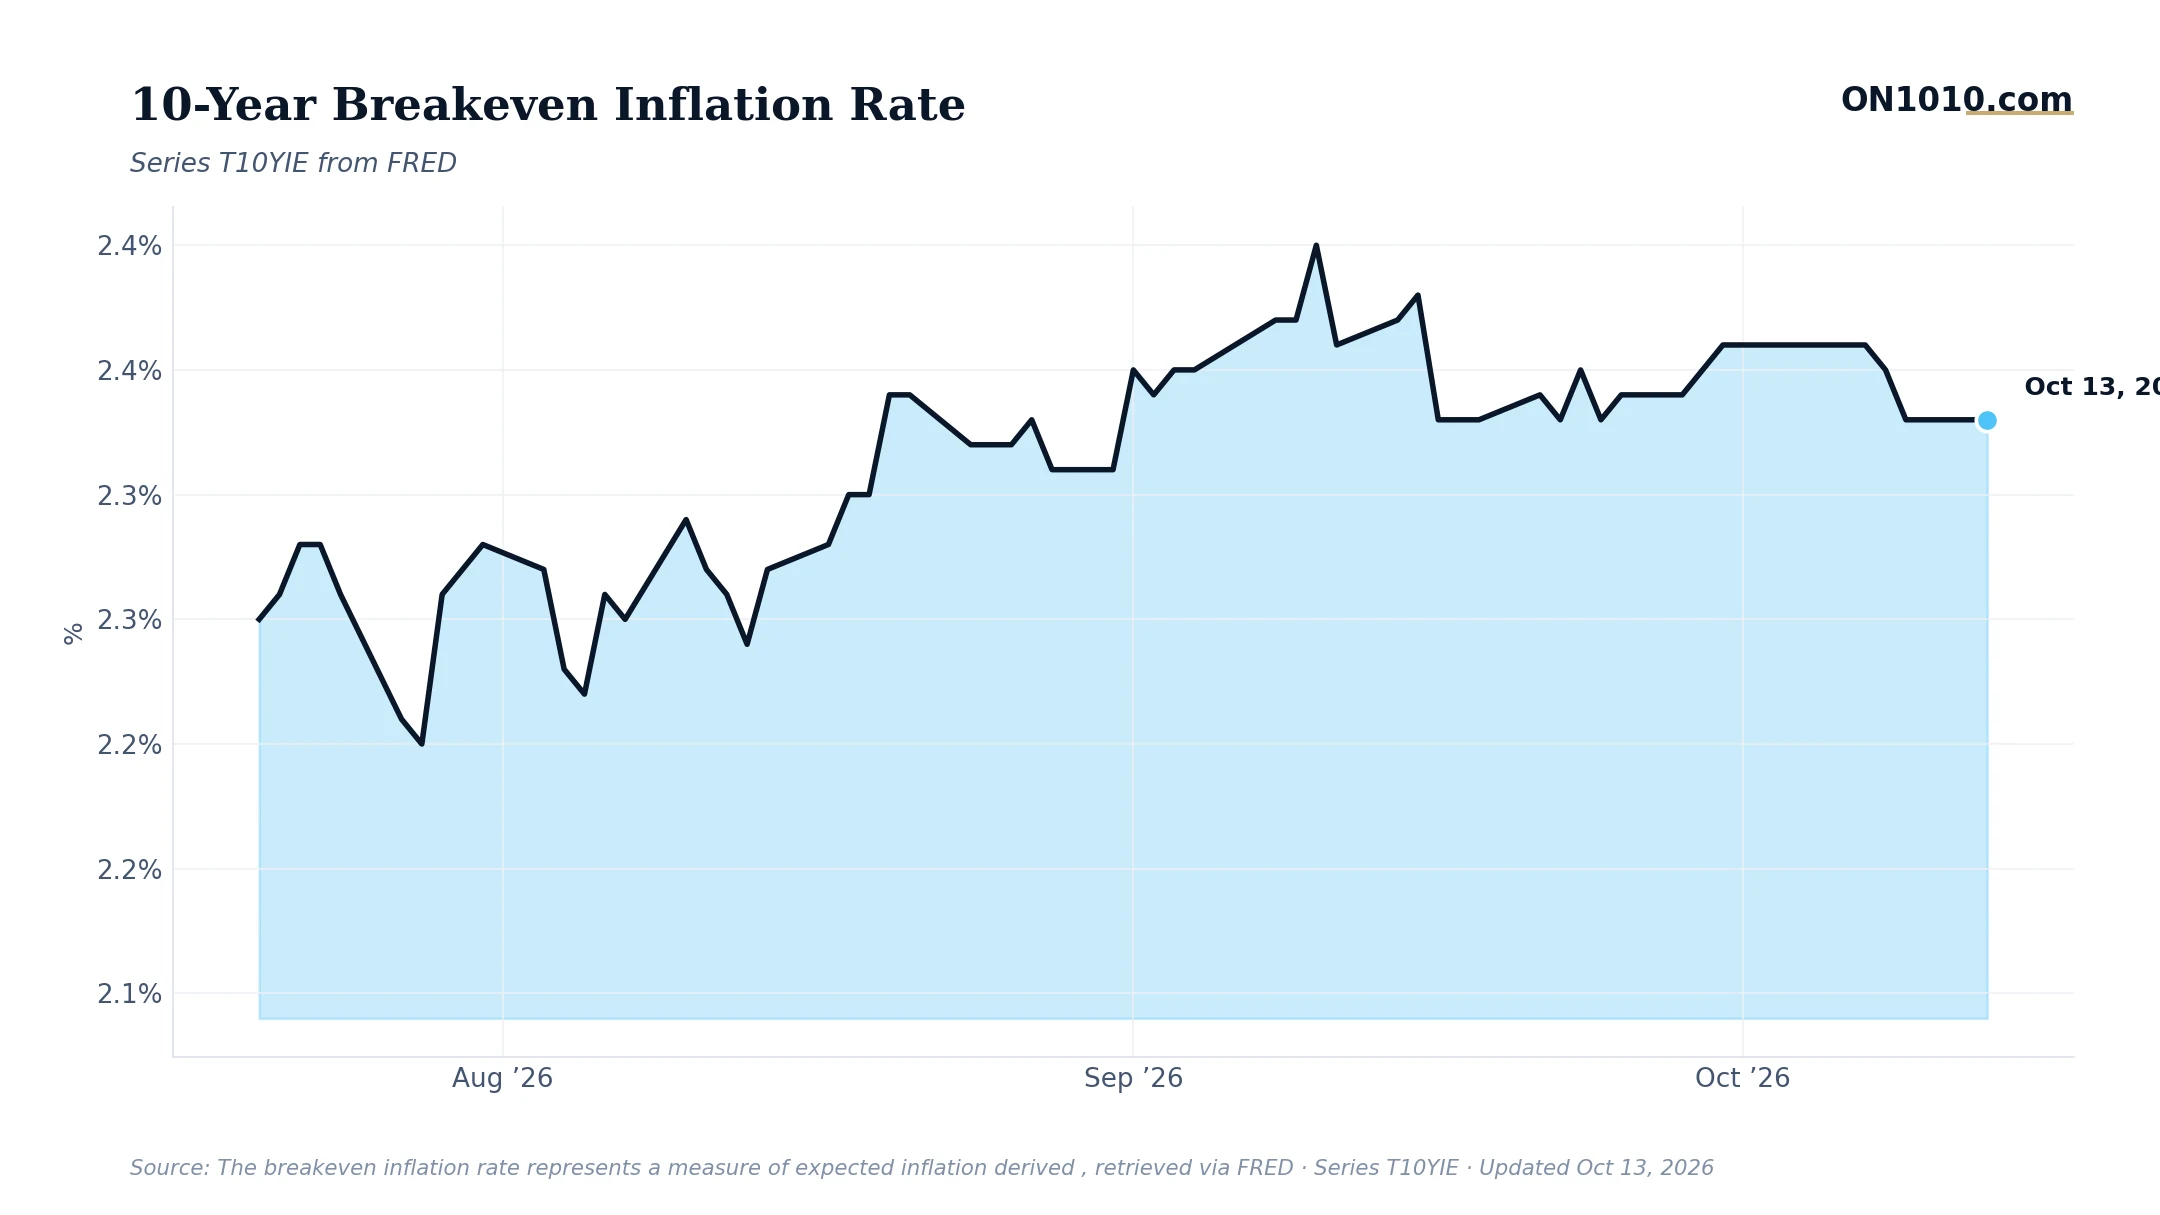
The 10-year breakeven inflation rate has sat at 2.33% for the past five trading days, barely budging after a mild drift down from 2.36% earlier in the month. Markets are expressing a view on inflation’s future, and right now that view is: “roughly where the Fed wants it, and stable.”
The breakeven rate is what you get when you subtract the yield on inflation-protected Treasuries (TIPS) from regular Treasury yields. It represents what bond investors collectively expect inflation to average over the next decade. At 2.33%, they’re pricing in inflation just above the Fed’s 2% target, close enough to call it anchored, but not so close that anyone can declare victory.
Here’s the tension worth noticing: core inflation is still running hot relative to history, monetary policy is restrictive by historical standards, and long-term interest rates are in their upper range historically. Consumer sentiment is near historic lows. Credit spreads are wide. The overall picture is a system under pressure. Yet the bond market’s long-run inflation expectation has barely moved.
Two readings on that: either the market genuinely believes the Fed has the situation under control over a 10-year horizon, or complacency has settled in and the near-term risks aren’t being fully priced. Historically, when real policy rates are this high alongside elevated long-term rates, the economy has tended to slow. In past cycles, investors and business operators have watched whether breakevens held firm or started creeping lower as demand softened, because falling breakevens can signal a shift in the growth outlook as much as the inflation outlook.
The question this raises for capital allocation decisions: if breakevens are stable but the underlying stress indicators are not, which one is telling the more complete story? A qualified financial professional can help connect that question to specific circumstances.
Bottom Line: The inflation expectations market looks calm. The rest of the dashboard is decidedly less so. Watch whether that gap closes, and if it does, which side moves first.
Source: Federal Reserve Economic Data (FRED)
ON1010 Research is an independent publisher of economic education and is not a registered investment adviser, broker-dealer, or investment company. This content is for educational and informational purposes only and is not investment advice or a recommendation to buy, sell, or hold any security. Published under the publisher exemption recognized by Section 202(a)(11)(D) of the Investment Advisers Act of 1940 (Lowe v. SEC). Always consult a qualified financial professional before making any financial decision.
Free Research
The economy moves fast. We make sure you move faster.
Economic data, policy shifts, and market signals — delivered to your inbox.
Subscribe Free