
The Yield Curve Keeps Healing. Here’s What the Bond Market Is Actually Saying.
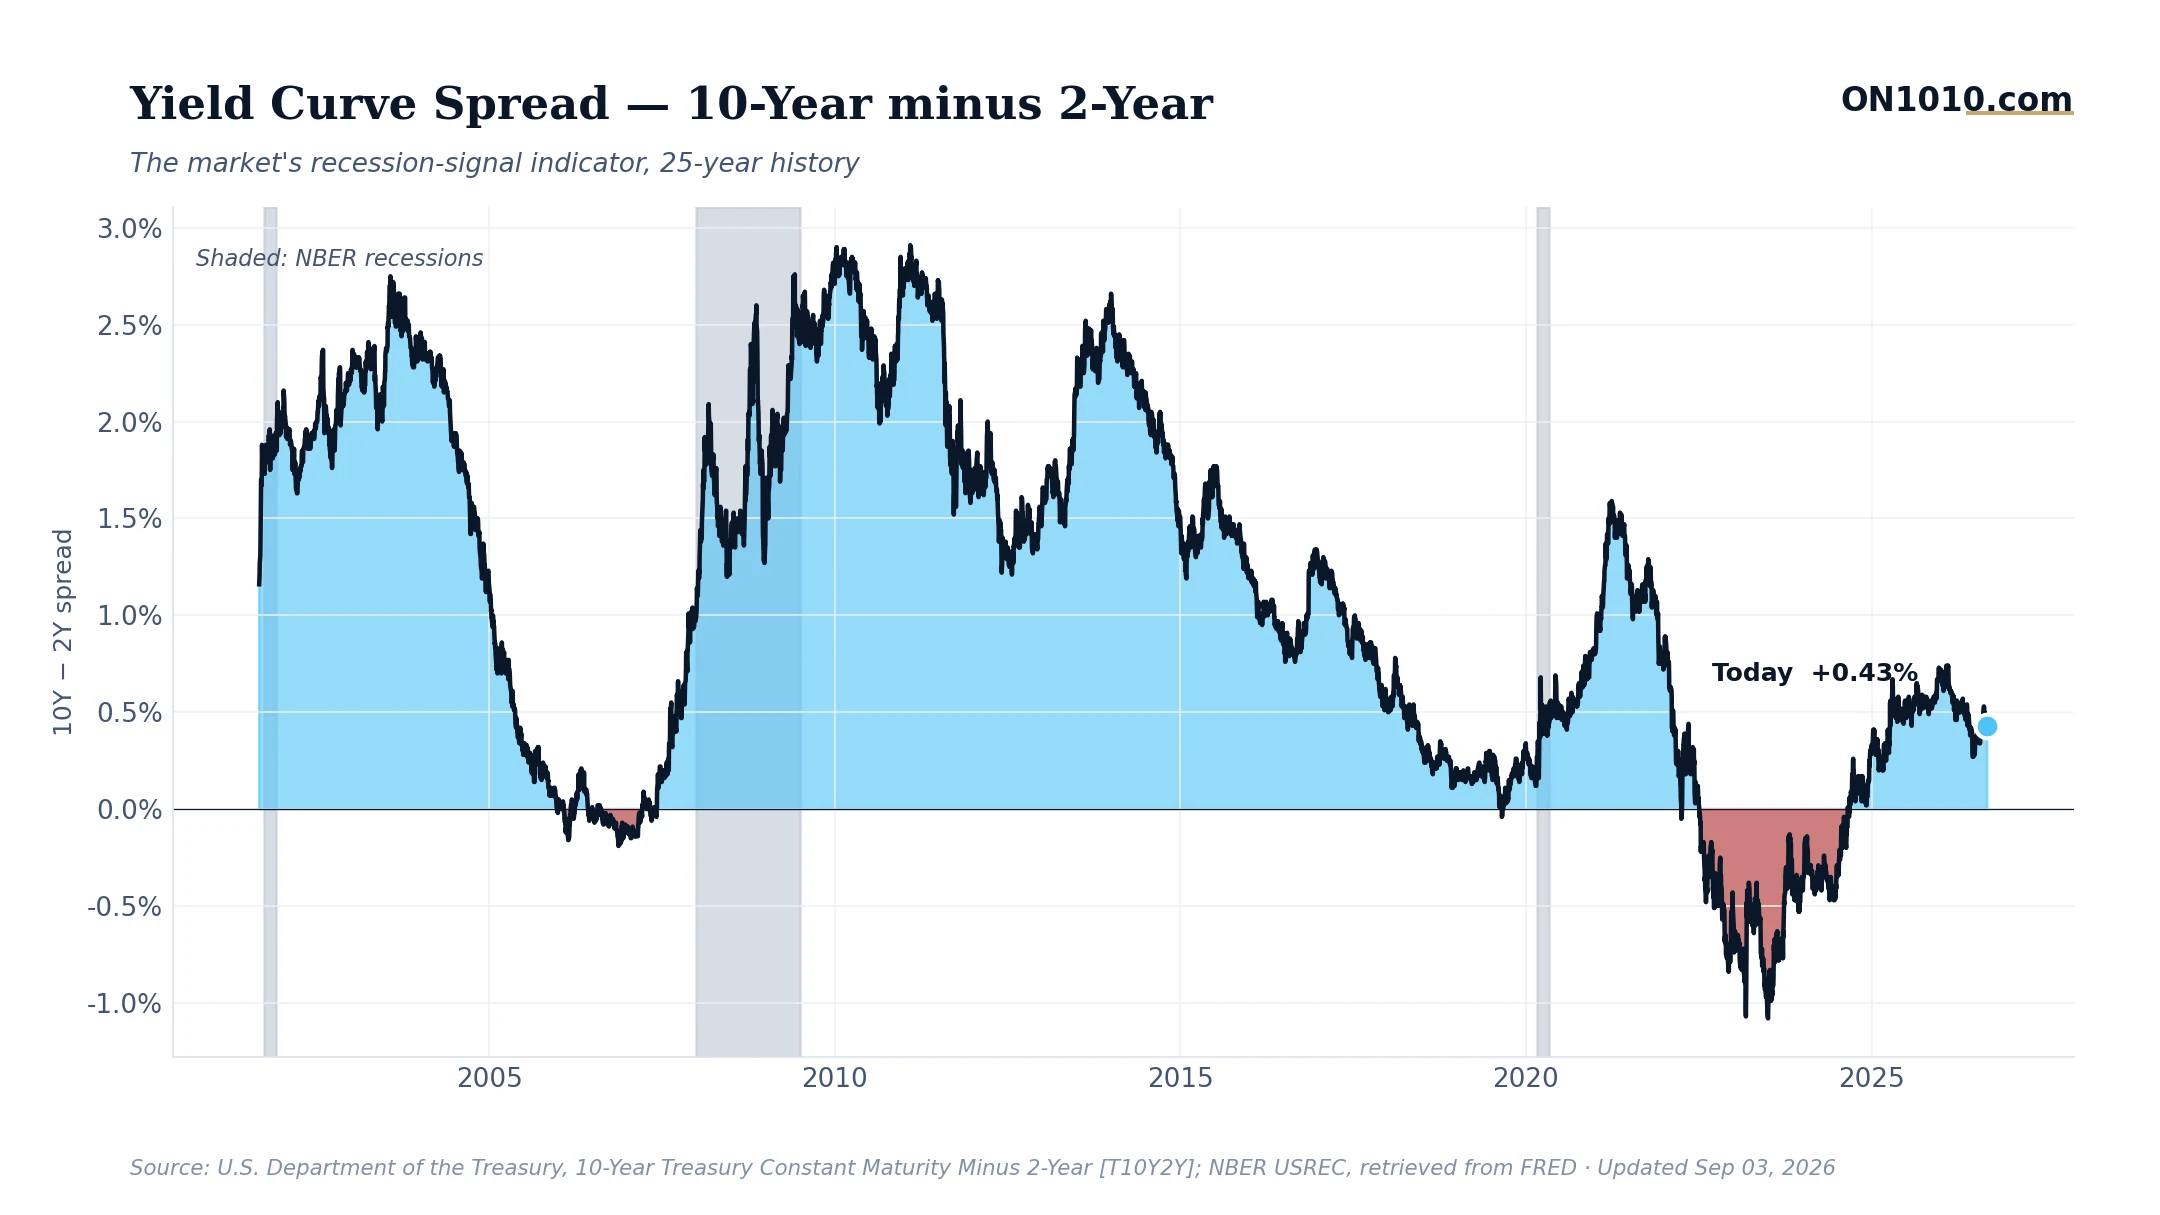
The 10-year to 2-year Treasury spread just ticked up to 0.43% on September 3, its highest reading in this recent stretch, after holding at 0.40% for two straight days. The move is small in absolute terms. The direction, and what it tells us about where the bond market’s head is at, is worth paying attention to.
This spread was deeply negative through much of 2022 and 2023, one of the most prolonged inversions in modern history. The fact that it has not only un-inverted but is now running comfortably positive is a meaningful shift in market psychology. When long-term yields sit meaningfully above short-term yields, bond investors are saying they believe the Fed’s next move is more likely to be a cut than a hike, and that the economy has enough runway ahead to reward patience over safety. That reads as a constructive signal. It also fits the broader picture: credit spreads are historically tight (a sign that lenders see very little risk of corporate defaults), and the equity market is holding above both its 50-day and 200-day moving averages.
But here’s the tension worth sitting with. Long-term interest rates are sitting in the upper range of their historical record, which means the cost of financing a home, a factory, or a balance sheet remains genuinely elevated even as the curve normalizes. That combination (normalizing shape, high absolute level) is a regime investors and business operators have rarely had to navigate. Historically, when the curve has re-steepened after a deep inversion, economic expansions have often followed, but the lag between the signal and the payoff has ranged from a few months to well over a year. And with core inflation still running hotter than roughly nine in ten months on record, the Fed’s room to accelerate rate cuts remains constrained.
In past cycles, investors have watched the re-steepening of the curve as an early signal that the tightest phase of monetary policy may be behind us. The question that tends to follow: which parts of the economy, and which businesses, are best positioned to benefit as the cost of capital gradually comes down from historically high levels?
Bottom Line: The yield curve’s continued healing is one of the more constructive signals in today’s data. The more interesting question is whether the pace of normalization accelerates from here, or stalls as sticky inflation keeps the Fed on hold longer than the bond market expects.
Source: Federal Reserve Economic Data (FRED)
ON1010 Research is an independent publisher of economic education and is not a registered investment adviser, broker-dealer, or investment company. This content is for educational and informational purposes only and is not investment advice or a recommendation to buy, sell, or hold any security. Published under the publisher exemption recognized by Section 202(a)(11)(D) of the Investment Advisers Act of 1940 (Lowe v. SEC). Always consult a qualified financial professional before making any financial decision.
Free Research
The economy moves fast. We make sure you move faster.
Economic data, policy shifts, and market signals — delivered to your inbox.
Subscribe Free