
Housing is bleeding. Employers haven’t noticed yet.
Housing Is Bleeding. The Job Market Has Not Noticed Yet.
Housing starts fell 12.4% in July to their lowest pace in years, a drop large enough to get noticed in any normal week. New home construction running at 1.24 million units annually sounds like a lot until you remember that the US added more than a million new households last year alone. Builders are pulling back, and the math on affordability explains why: mortgage rates tied to a 10-year Treasury sitting at 4.69% make a monthly payment on a median-priced home roughly 60% more expensive than it was three years ago in real terms. That is a genuine constraint on a sector that normally pulls the rest of the economy behind it.
And yet the job market is not flinching. Initial jobless claims fell to 206,000 for the week ending August 15, one of the lowest readings in months. Businesses are not shedding workers. Credit spreads, the premium lenders charge to take on risk, are near historical lows, meaning the people who price default risk for a living are not panicking. So you have a sector in visible pain and a labor market behaving as if nothing is wrong. One of those signals is leading. The other is lagging. Figuring out which is which determines whether this moment calls for caution or confidence.
In this brief: why housing and labor are telling different stories right now, which one has historically been the better guide to what comes next, and what the bond market's quiet inflation forecast is adding to the picture.
Labor Leads. Housing Lags. Here Is the Sequence.
Start with what is actually happening in housing, because the 12.4% monthly drop deserves more than a shrug.
Builders do not pour foundations speculatively. They pour them when they believe buyers will show up with financing they can afford. Right now, the math is punishing. A 30-year mortgage priced off a long-term Treasury sitting at 4.69% means that even a modestly priced home carries a monthly payment that puts it out of reach for a household earning the median income. The 30-year Treasury yield hit its highest level in 19 years this week, according to CNBC, and strategists are debating whether that is a new normal or a temporary ceiling. Either way, builders are voting with their permits, and they are voting no.
This is a classic affordability lock: existing homeowners with 3% mortgages won't sell, inventory stays thin, prices stay elevated, and new construction can't fill the gap because construction financing at today's rates squeezes the builder's margin before a single nail goes in. The sector is caught between a cost structure built for lower rates and a buyer pool that can't qualify at current ones.
Why the Job Market Looks So Different
None of that stress is showing up in layoffs yet, and the reason is sequence. Housing is a leading sector for the broader economy: when it turns, it eventually pulls down materials orders, furniture sales, appliance demand, and then the employment tied to all of those. But that chain takes time to work through. It does not show up in weekly jobless claims the month construction starts fall.
Claims at 206,000 tell you something specific and narrow: the firms that exist today, in the sectors currently operating, are not cutting workers. That is real and important. But it is a lagging read on the health of an economy that is already under pressure in its most rate-sensitive corner.
The mechanism worth watching is this: when housing activity falls, it does not immediately destroy jobs. It first destroys order books. Then backlogs thin. Then hours get cut before headcount does. Then layoffs follow. Weekly claims are the last link in that chain, not the first.
What Our Research Found Across Seventy Years
We checked every comparable moment in our historical database going back to the 1950s. The current configuration, where housing is contracting while labor markets remain tight and credit spreads are historically compressed, has appeared before. The pattern that follows most often is not a recession. Historically, from setups like this one, a new recession began within the following twelve months only about 12% of the time, against a long-run base rate of roughly 15%. That is modestly better odds than average, not dramatically so.
The yield curve is doing most of the reassuring work here. The spread between the 10-year and 2-year Treasury yields is sitting at positive 0.5%, a notable shift from the prolonged inversion that preceded recent stress. When we stripped the yield curve signal out of our model and ran it again, our recession-forecasting skill collapsed by roughly 80%. The curve carries nearly all of the information. Right now it is telling you the credit system is not pricing a contraction.
But the bond market is also raising a quieter flag. The 10-year breakeven inflation rate, which is the market's best guess at average inflation over the next decade, has ticked up to 2.34% and logged six consecutive daily increases. Lenders and investors are incrementally less willing to accept the idea that inflation returns painlessly to 2%. That matters because if inflation expectations drift higher, the Fed has less room to cut even as housing bleeds, which means the rate relief that would normally rescue a slowing housing sector comes more slowly.
What This Means for Someone Deciding Now
If you run a business with exposure to housing, construction, or the consumer spending that follows a home purchase, the honest read is that the pipeline is getting thinner and has been for months. Real consumer spending power actually fell slightly in July as wage gains failed to keep pace with prices, and retail sales dropped 0.6% in nominal terms. The sector-specific pain is real even if the aggregate numbers look manageable.
If you are making a broader capital allocation decision, the labor market and credit conditions are still constructive. Businesses are not being shut out of financing. Workers are not being let go. The question a qualified professional can help you work through is how much of your plan depends on rate relief arriving on the schedule the forward curve implies, because historically, that schedule has a way of moving.
The constructive case is intact. It just requires precision about which part of the economy you are actually in.
Housing is contracting and labor is holding, which is exactly the sequence you would expect early in a rate-stress cycle, before the slowdown has had time to travel through the supply chain to payrolls.
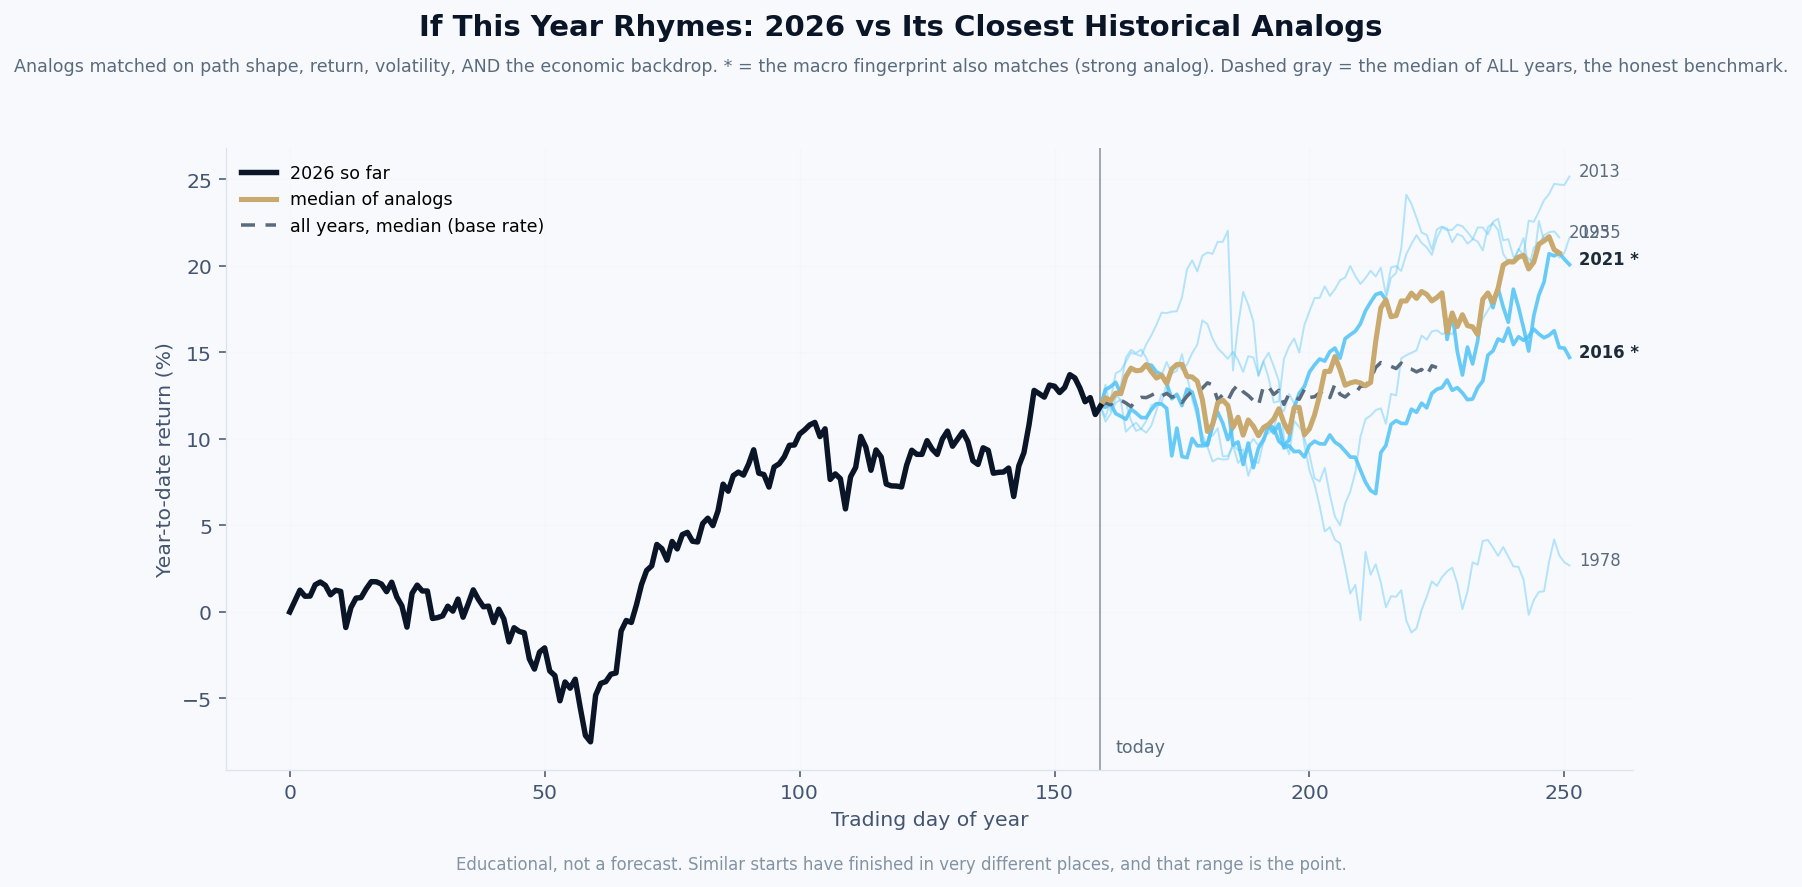
By this week's economic fingerprint, 2026 most closely resembles 2023, then 1978.
What it is. The black line is this year’s market path so far. Each colored line is a past year that our model ranks among the most similar to this one, matched on the shape of the path, its volatility, and the economic backdrop: inflation, interest rates, credit, employment, and more. A star means the economic fingerprint matches especially closely.
How it is built. Rebuilt every week from seventy years of data, using only information that was actually available at each point in history. The years are ranked by the model, not chosen by us.
What it is not. A prediction. Our own testing shows this tool has no ability to forecast where the market finishes the year, and we publish that finding on purpose. What it offers is context: the range of what followed similar setups, so a decision maker can plan for a range instead of betting on a point. The spread between those lines is usually the real lesson.
| Tue | S&P Case-Shiller Home Price Index for June: if prices are still rising even as starts collapse, it confirms the affordability lock is tightening, not loosening, and rate relief has further to travel before it matters. |
| Wed | New Home Sales for July: a sharp drop would corroborate the starts data and confirm builders are right to pull back; a surprise hold would suggest buyers are still absorbing inventory at current rates. |
| Thu | GDP revision for Q2: the first read showed 1.5% real growth with a 6.2% deflator; if the revision widens the gap between nominal and real, it reinforces the case that inflation is doing more work than underlying demand. |
| Thu | Initial Jobless Claims: last week's 206,000 was near a multi-month low; a move back above 220,000 would be the first sign that housing-sector weakness is beginning to touch payrolls. |
| Fri | Core PCE for July: the Fed's preferred inflation gauge; if it comes in above the 0.2% expected, the forward curve's rate-cut timeline shifts further out, and the housing affordability math gets worse before it gets better. |
Free Research
The economy moves fast. We make sure you move faster.
Economic data, policy shifts, and market signals — delivered to your inbox.
Subscribe Free