
Housing Starts Slip Again, But the Real Story Is What’s Holding Them Up
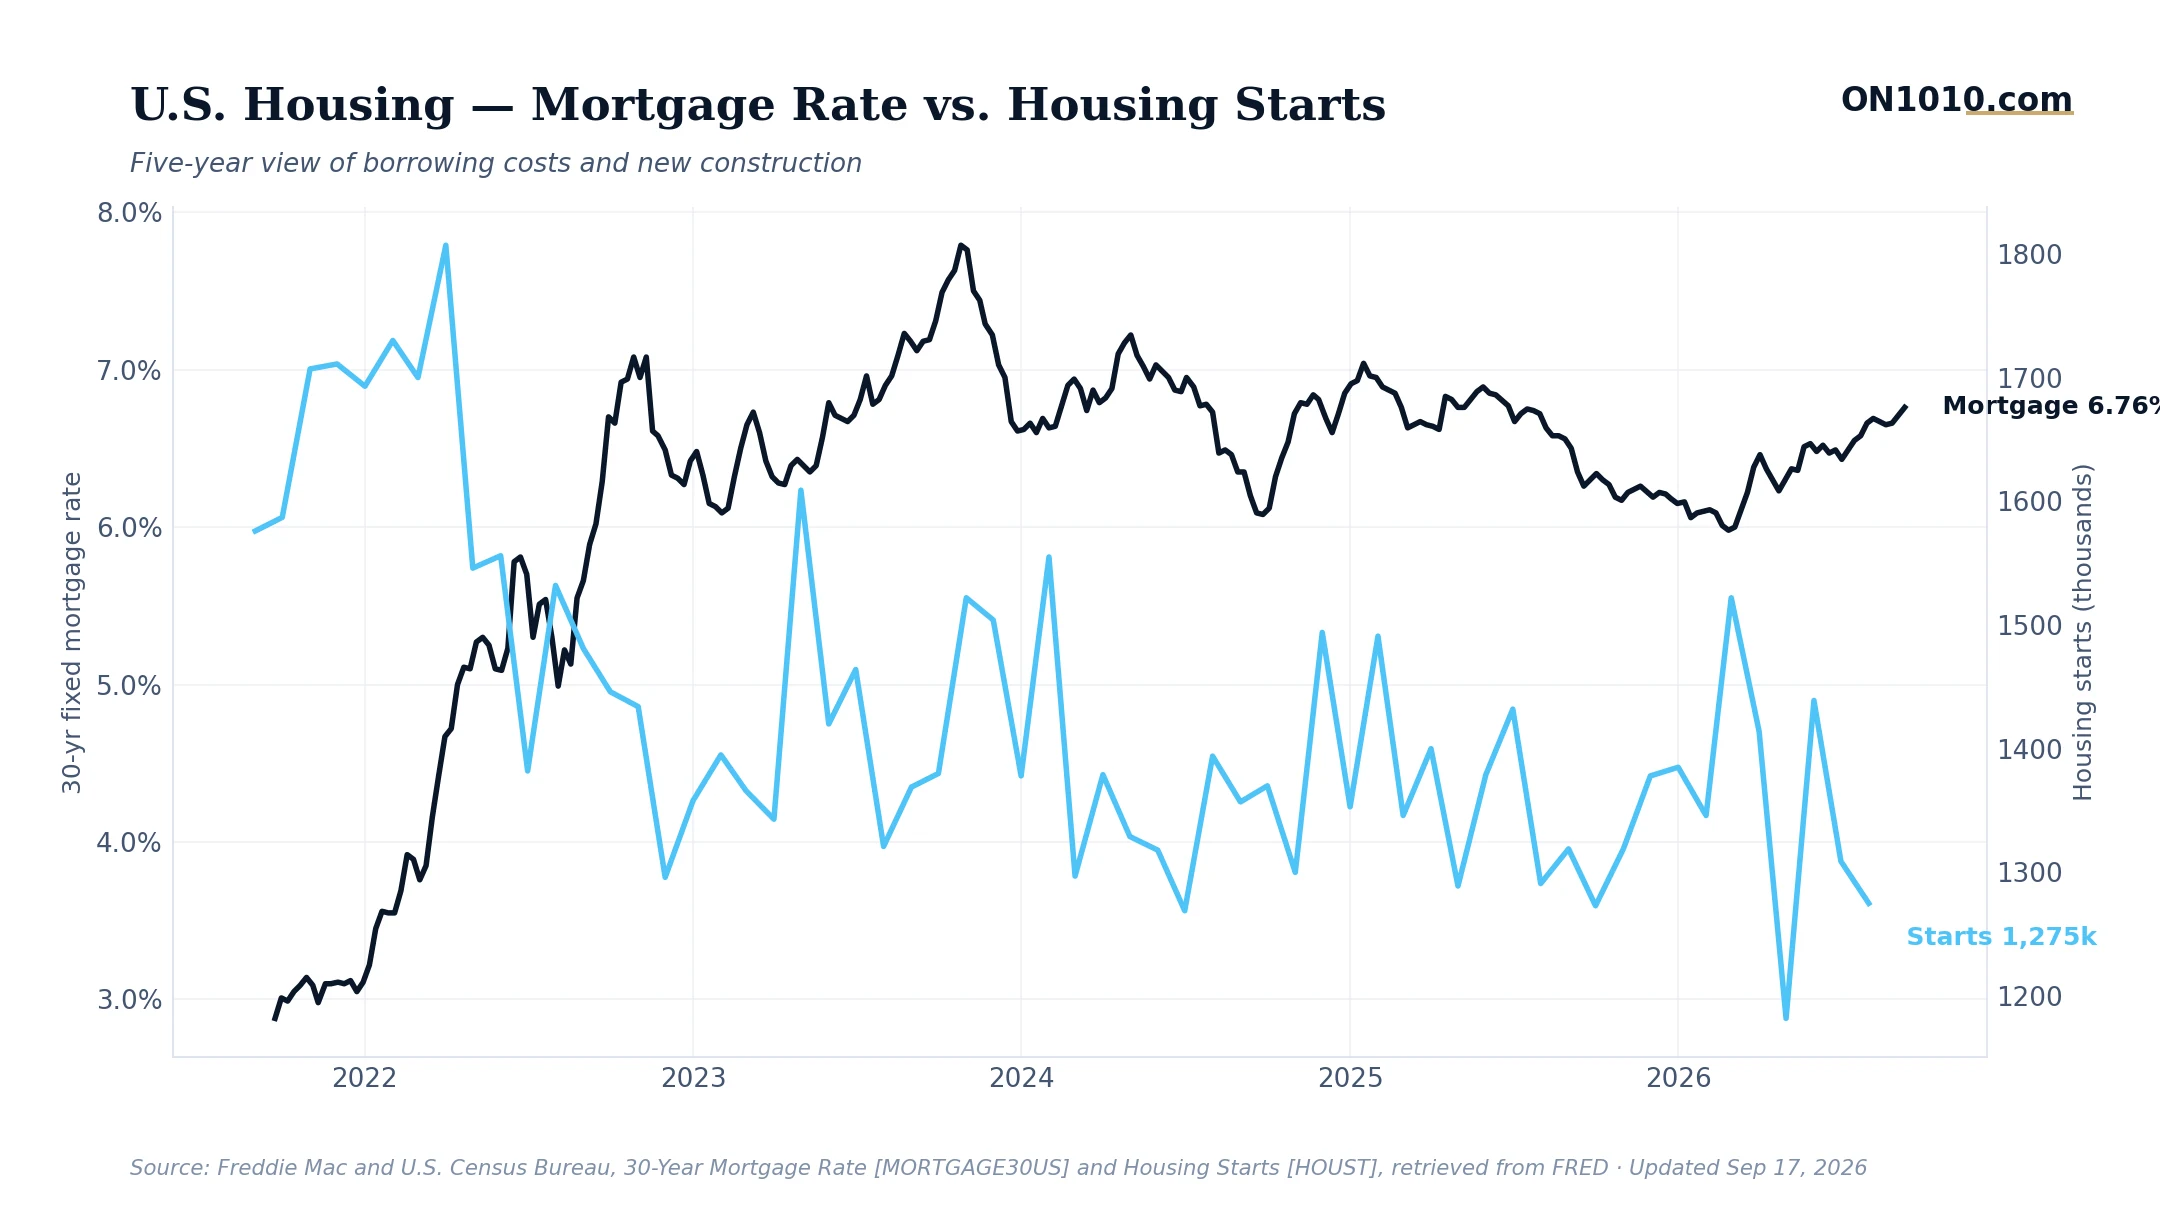
Housing starts fell 2.6% in August to an annualized pace of 1,275,000 units, the second consecutive monthly decline and 200,000 below the March peak of 1,522,000. On the surface, that looks like a slowdown. Look closer and the more interesting question is why starts haven’t fallen further.
Mortgage rates are sitting in the upper quarter of their historical range. Consumer sentiment is near its weakest in decades. Starts have dropped roughly 16% from March’s high. And yet, on a year-over-year basis, this August reading is almost exactly flat with a year ago, up just 0.16%. The housing market is bending under pressure, not breaking.
Part of the explanation is structural. The country entered this rate cycle with a significant underbuilding deficit accumulated over the decade after 2008. That structural shortage provides a floor that a purely cyclical analysis would miss. Builders are also contending with a “lock-in effect” that has kept existing home inventory thin: sellers with 3% mortgages have little incentive to list and take on a higher rate. New construction fills a gap that the resale market can’t. That dynamic is not going away quickly.
Historically, when housing starts decline steadily over several months in a high-rate environment, they have often served as an early warning for broader construction employment and building material demand, both of which tend to lag by two to four quarters. Business operators in those supply chains, and investors watching those sectors, have used starts trends to think about forward capacity and pricing. The question this data raises is whether the structural shortage can continue to provide a floor, or whether rate fatigue and weakening sentiment eventually overwhelm it.
Bottom Line: The housing market is caught between a persistent shortage that won’t let it collapse and rates that won’t let it recover. Watch whether starts stabilize in this 1,200,000 to 1,300,000 range or resume their slide, because the next leg down would be harder to explain away as noise.
Source: Federal Reserve Economic Data (FRED)
ON1010 Research is an independent publisher of economic education and is not a registered investment adviser, broker-dealer, or investment company. This content is for educational and informational purposes only and is not investment advice or a recommendation to buy, sell, or hold any security. Published under the publisher exemption recognized by Section 202(a)(11)(D) of the Investment Advisers Act of 1940 (Lowe v. SEC). Always consult a qualified financial professional before making any financial decision.
Free Research
The economy moves fast. We make sure you move faster.
Economic data, policy shifts, and market signals — delivered to your inbox.
Subscribe Free