
Lenders are betting against the worst mood in 70 years
Lenders Are Betting Against the Worst Consumer Mood in Seventy Years.
Consumer sentiment just posted one of its worst readings in the seventy years anyone has been asking. Households are gloomier than they were in 2008, gloomier than in the early 1980s when unemployment was above 10%. That is not a statistical quirk. That is a historically extreme signal, and if you believed it at face value, you would batten down every hatch you own.
Then look at what lenders are actually doing. Credit spreads, the extra return lenders demand to take on risk instead of parking money in Treasury bonds, are near the low end of their historical range. When spreads are this tight, lenders are charging almost nothing extra to take on risk, which is what credit looks like when nobody is genuinely worried about defaults. One of these two readings is telling the right story about where the economy actually sits. They cannot both be right.
In this brief: why our own historical testing suggests the lenders have the better argument, what the energy market disruption means for the inflation fight the Fed is quietly losing, and what the slowing second derivative of AI investment tells business owners about the next two years.
Lenders Are Winning the Argument. Here Is the Evidence.
Start with the contradiction, because it deserves to be taken seriously before it gets resolved.
Consumer sentiment at its current level has historically been associated with recessions, layoffs, and genuine economic distress. When households feel this bad collectively, they usually have a reason. The reading is not just low. It is at the very bottom of the range. Economists who build forecasting models treat mood surveys as meaningful data, and this week they are flashing red.
The credit market disagrees. Lenders are not demanding extra compensation for the risk they are taking. That matters because lenders, unlike survey respondents, have money at stake. When a bank or institutional investor prices a corporate loan, they are making a bet with real capital. Tight spreads mean they are confident enough in borrowers' ability to repay that they are not charging much of a risk premium. That is a strong signal. Historically, recessions are almost always preceded by spreads widening, not tightening.
What Seventy Years of Data Actually Shows
We went back and looked at every month since 1974 where the economic configuration resembled today's: sentiment near its historical floor, credit loose, rates elevated, growth near its long-run midpoint. A year out, from similar setups, a new recession began about 13% of the time, modestly below the historical average of 15%. The mood surveys, it turns out, have been nearly useless as recession predictors on their own. The yield curve carries almost all of the forecasting work that actually holds up across decades.
The yield curve today shows the 10-year Treasury yielding 4.68% against the 2-year at 4.23%, a positive gap of 0.47 percentage points. A positively sloped curve, where longer-term rates sit above shorter-term rates, has historically been the bond market's way of saying growth continues. An inverted curve, where short rates exceed long rates, is the shape that has preceded nearly every recession in modern history. Right now the curve is not inverted. That single fact does more heavy lifting in our historical model than all the sentiment surveys combined.
The honest caveat: none of this eliminates the 13% scenario. It just sizes it correctly.
The Inflation Fight the Fed Is Not Admitting It Is Losing
The Fed held rates in the 3.5% to 3.75% range this week, and three members voted to hike, which is the detail that matters more than the hold itself. When three of twelve voting members dissent in favor of tightening, the committee is not united. Bond investors are listening. The 10-year breakeven inflation rate, the market's embedded forecast for average inflation over the next decade, ticked up to 2.28% this week. That is above the Fed's 2% target, and it has been drifting higher.
The energy market is making this harder. Gasoline is running at roughly $4.10 per gallon nationally, roughly 5% above where the underlying crude price would normally imply. Two shipping chokepoints are simultaneously disrupted: the Strait of Hormuz and, as of this week, the Bab Al-Mandab strait near Yemen, which carries roughly five million barrels of Saudi oil per day. Seasonal relief in energy prices is not expected until October. Until then, every fill-up is a small inflation tax on households and a direct input cost for businesses that move goods.
The PCE price index, the Fed's preferred gauge, posted its first monthly decline in recent memory in June, which is real progress. But one month of deflation alongside a still-hot energy market and three hawkish Fed dissenters is not the all-clear. Core inflation, which strips out food and energy to show the underlying trend, held at 3.3% in June. That is still well above target.
The AI Investment Story Just Changed Shape
The technology sector is lagging the broad market by nearly six percentage points this year, and understanding why matters for anyone making capital commitments in the next twelve months. When long-term rates are high and rising, the present value of profits that are years away shrinks mechanically. Technology companies, whose earnings are often weighted toward the future, feel that compression first.
But there is a second layer beneath the rate story. TSMC, the world's most important semiconductor manufacturer, raised its 2026 capital spending plan to $64 billion, up from $41 billion last year. That sounds bullish for AI infrastructure. Look at the trajectory, though: spending is growing 56% this year, but next year's plan implies growth closer to 20%. The second derivative, the rate at which investment growth is accelerating, is slowing. In past cycles, slowing investment growth has arrived before slowing investment itself. Businesses cut hiring and defer projects when they see that curve flattening. The question for anyone planning capital commitments is whether 2026 is the year the AI infrastructure boom runs at full speed, or the year it begins to mature into something more measured. The spending numbers suggest the latter is already beginning.
For business decision makers, the frameworks that apply here are straightforward: margins lead employment, capital flows toward where returns are most visible, and the cost of capital right now is high enough to make long-duration projects more expensive than they looked two years ago. The constructive backdrop is real. The interest rate environment is doing quiet damage to balance sheets carrying variable-rate debt or facing refinancing in the next year. Both things can be true simultaneously, and the businesses that plan for both will be better positioned when the next manufacturing cycle finds its footing, which our historical work places tentatively in late 2028.
Lenders are charging almost nothing extra to take on risk while households have never been gloomier, and seventy years of data say the lenders have almost always had the better read on what comes next.
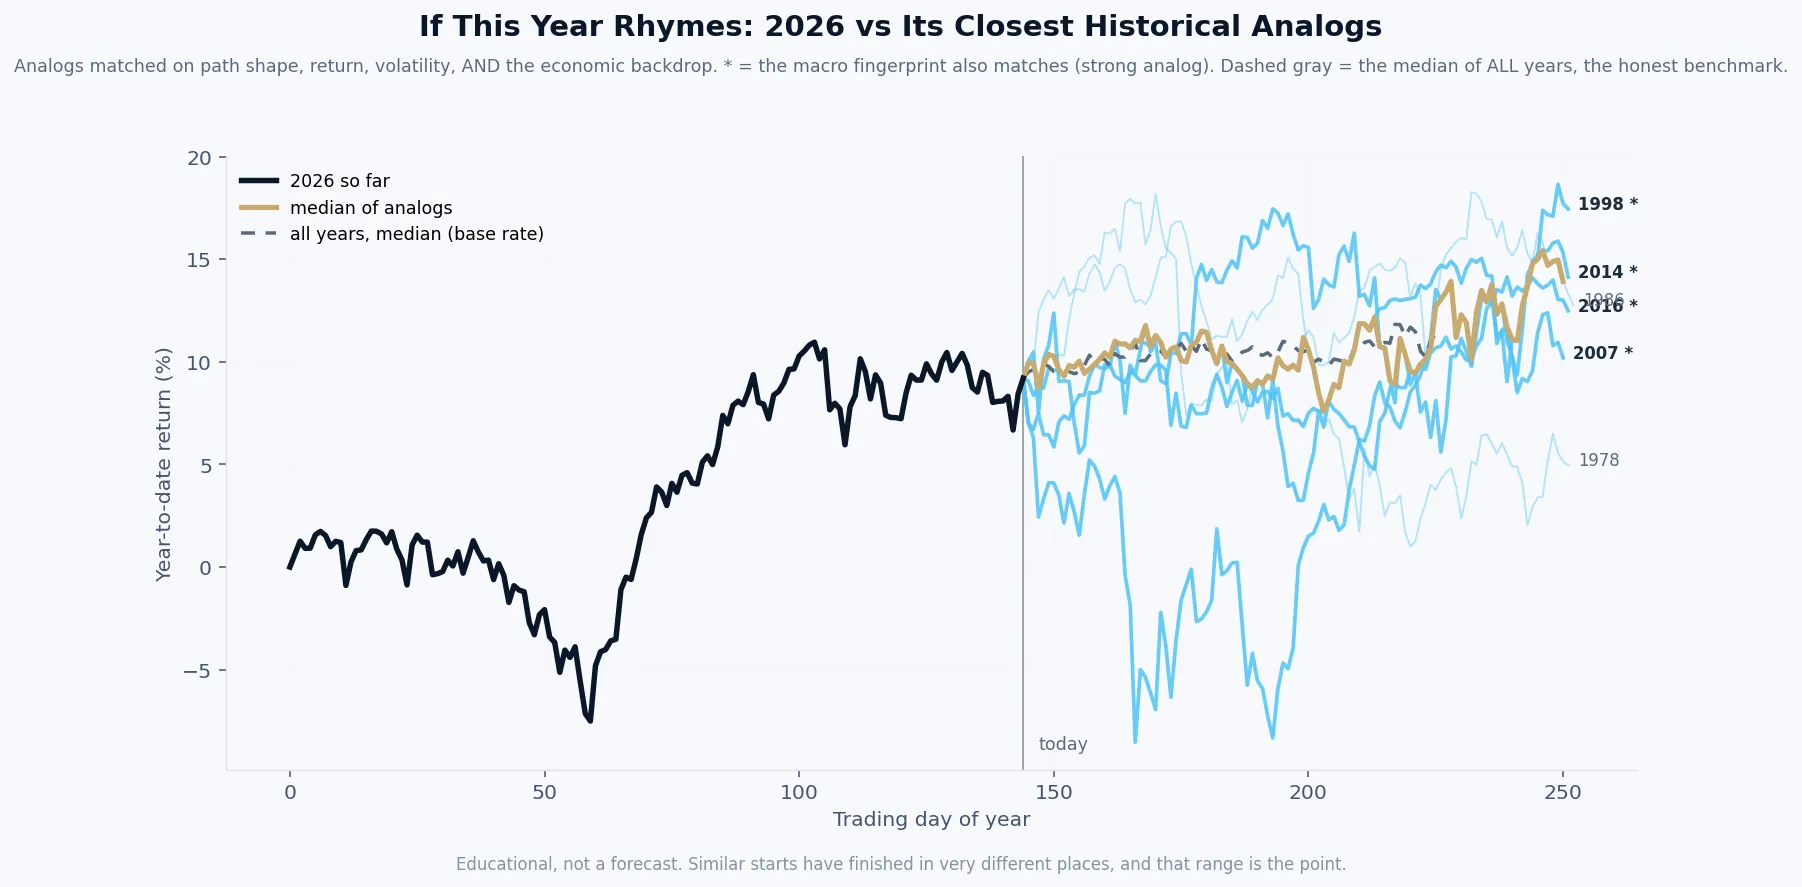
By this week's economic fingerprint, 2026 most closely resembles 2016, then 2007.
What it is. The black line is this year’s market path so far. Each colored line is a past year that our model ranks among the most similar to this one, matched on the shape of the path, its volatility, and the economic backdrop: inflation, interest rates, credit, employment, and more. A star means the economic fingerprint matches especially closely.
How it is built. Rebuilt every week from seventy years of data, using only information that was actually available at each point in history. The years are ranked by the model, not chosen by us.
What it is not. A prediction. Our own testing shows this tool has no ability to forecast where the market finishes the year, and we publish that finding on purpose. What it offers is context: the range of what followed similar setups, so a decision maker can plan for a range instead of betting on a point. The spread between those lines is usually the real lesson.
| Mon | ISM Manufacturing PMI for July: if it prints below 50 for the third consecutive month, the data would start confirming what the slowing AI investment trajectory is already suggesting about the factory cycle. |
| Tue | JOLTS Job Openings for June: a sharp drop in openings would be the first hard sign that tight credit and high rates are finally reaching the hiring decisions businesses make every day. |
| Wed | ISM Services PMI for July: services have been the economy's ballast while manufacturing slows, so a reading below 50 here would be the most significant data surprise of the week. |
| Thu | Weekly Jobless Claims: claims have been running below 200,000, which is historically tight; any move toward 230,000 or above would be the labor market finally showing what elevated rates have been quietly building toward. |
| Fri | July Nonfarm Payrolls: the headline number matters less than the revision to June and whether average hourly earnings growth is running ahead of or behind the 3.3% core inflation print, because that spread determines whether real wages are actually rising. |
Free Research
The economy moves fast. We make sure you move faster.
Economic data, policy shifts, and market signals — delivered to your inbox.
Subscribe Free