
The Long View, Week of July 06, 2026
The Signal
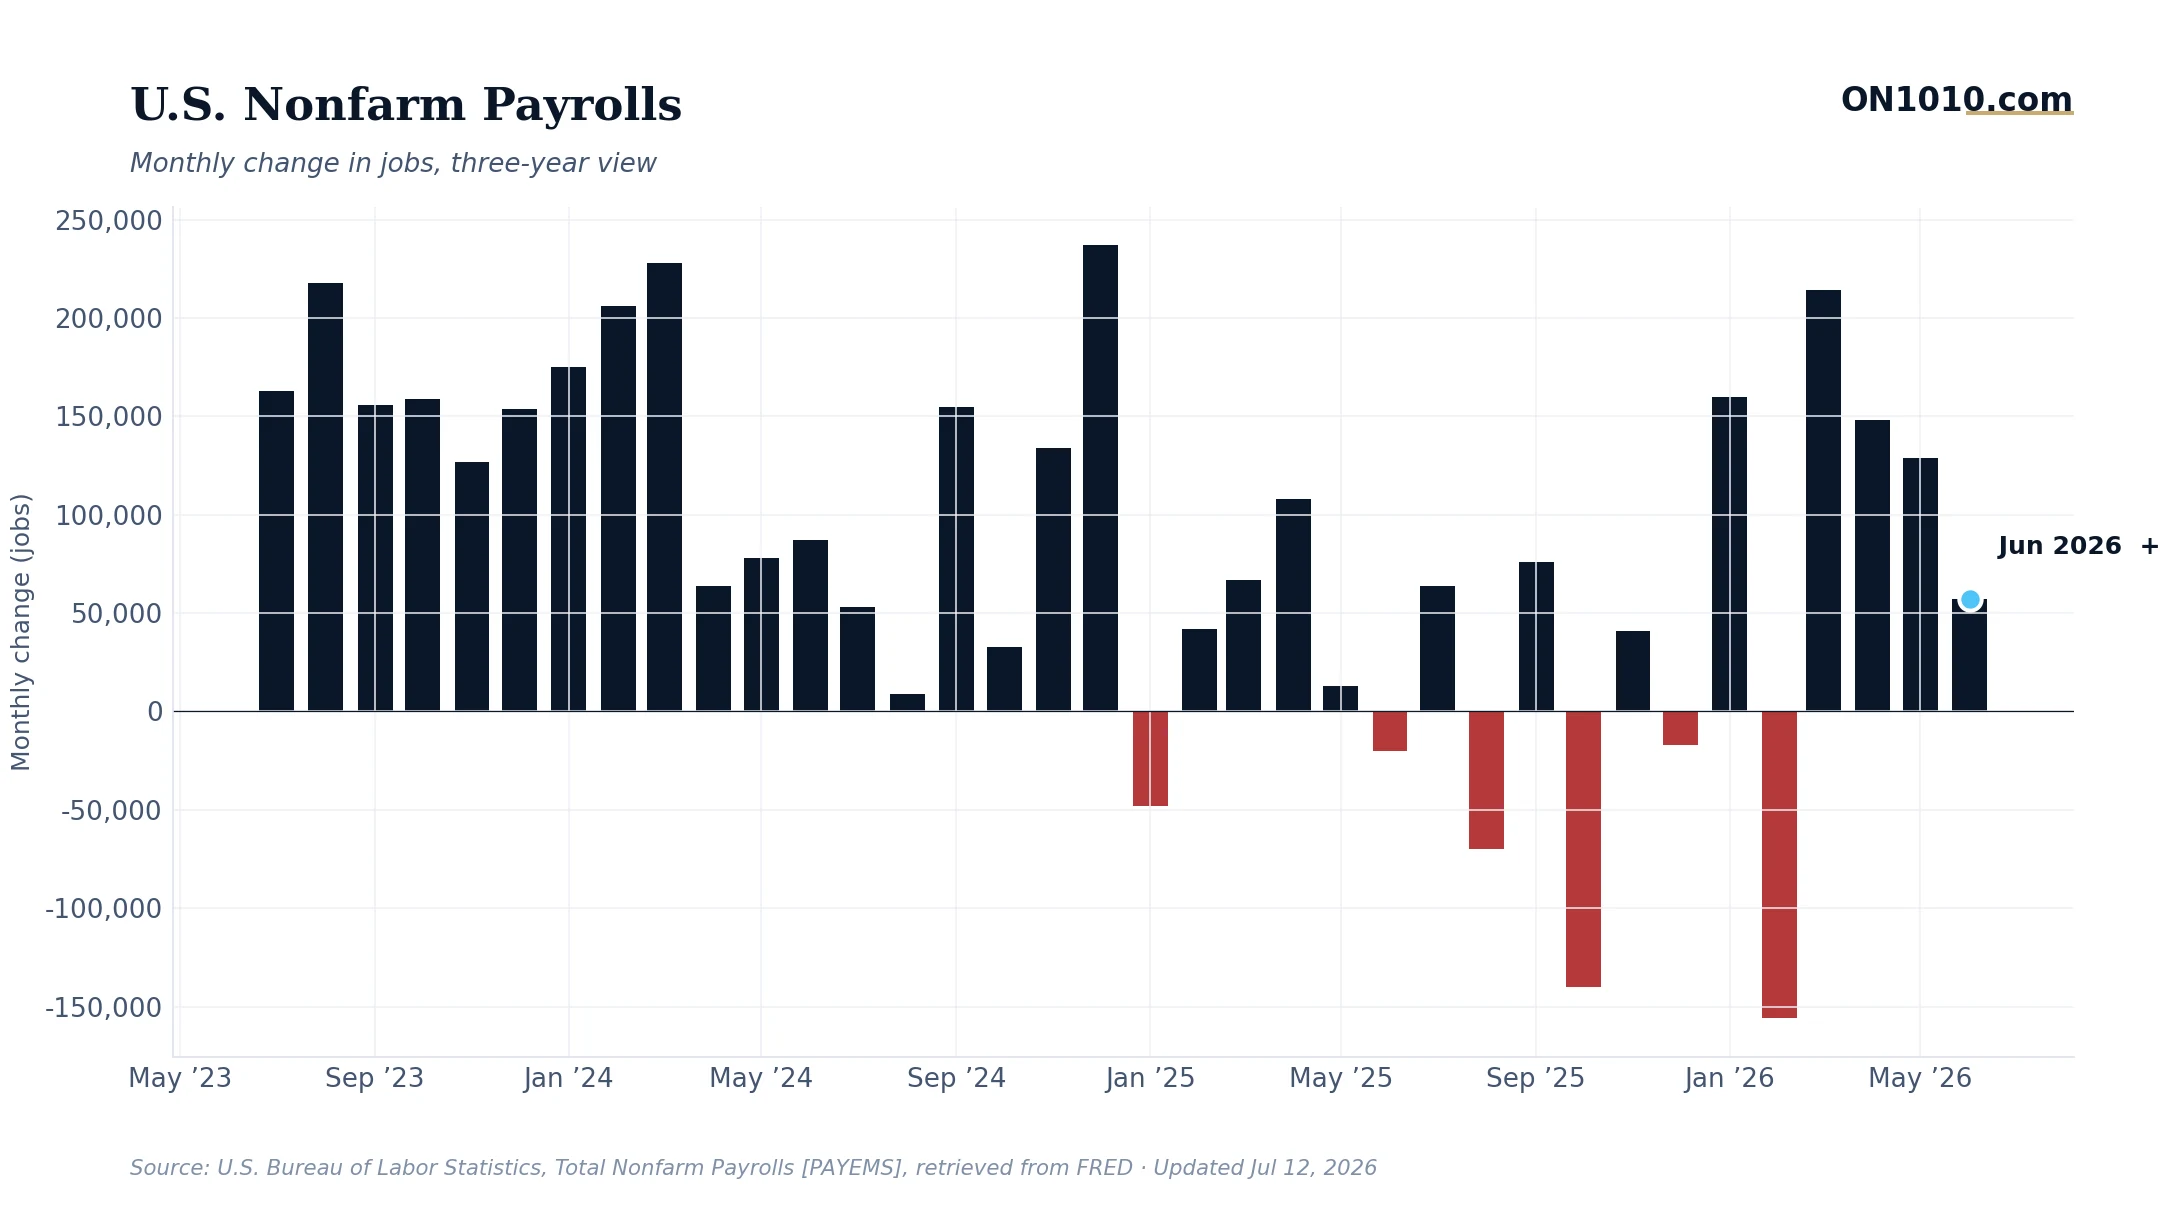
> The single most important thread of this week is the quiet but consequential reset happening in the American labor market, just as the housing market seizes up from the weight of elevated mortgage rates. June’s jobs report came in stronger than expected, but a meaningful portion of that strength may have been borrowed from the World Cup’s temporary hiring surge. Strip that out, and the underlying picture is a labor market that is resilient but slowing, at exactly the moment the Fed needs it to cool enough to justify rate cuts. Meanwhile, home sales fell in June even as prices hit an all-time high, a classic affordability trap that tells you buyers haven’t disappeared but have been priced and mortgaged out of the market. These two datasets, jobs and housing, are the clearest window right now into whether the Fed’s holding pattern is working, or whether it is simply letting pressure build in places most people are not watching.
Market Pulse
S&P 500: SPY at approximately $754.95 (ETF proxy) (+1.2% (estimated, week ending July 11))
Equities pushed higher as the June jobs report reassured investors that the labor market is not collapsing, while falling gasoline prices kept consumer spending fears in check, giving markets a soft-landing narrative to work with.
Nasdaq: Approximate level not available from dashboard data (Current data was unavailable at time of writing)
Technology slightly outperformed the broad market on the week, with financials the standout leader at roughly 3.9 percentage points above SPY, suggesting institutional money is rotating into rate-sensitive cyclicals as the peak-Fed narrative holds.
10-Year Treasury: 4.54% (+0.06% from the 4.48% reading on July 1)
The 10-year yield continued its quiet climb because bond investors are pricing in the possibility that the Fed stays higher for longer, especially after a jobs report strong enough to remove any urgency for near-term cuts.
U.S. Dollar Index: Current data was unavailable at time of writing (Current data was unavailable at time of writing)
Trade policy uncertainty around USMCA’s end and the administration’s stance on Spain kept the dollar in a holding pattern, with no clear directional catalyst to break the range.
VIX: 15.03 (Down from a 20-day average of 17.18)
Volatility compressed as the jobs report removed the worst-case labor scenario, and falling gas prices gave consumers and markets one less thing to worry about heading into the summer.
WTI Crude: Current data was unavailable at time of writing (Current data was unavailable at time of writing)
Saudi Arabia resumed oil shipments through the Strait of Hormuz after a three-month pause, which added supply to the market and kept crude prices from spiking even as geopolitical risk remained elevated.
Three Stories That Matter
The World Cup Borrowed 40,000 Jobs From the Future. Now What?
Goldman Sachs estimated the 2026 FIFA World Cup added roughly 40,000 jobs to June’s nonfarm payrolls report. That is not a small number. It is the difference between a headline that says the labor market is strengthening and one that says it is holding steady. Temporary hiring spikes tied to events, construction, and hospitality are real jobs that show up in the data, but they evaporate just as cleanly when the event ends. The more honest read of June’s jobs data is the number underneath the noise.
Why it matters: When headline payroll numbers are distorted by one-time factors, the Fed’s reaction function gets harder to read. If policymakers are looking at the same adjusted picture that Goldman flagged, they will not treat June’s report as evidence the labor market is reaccelerating. That keeps the Fed on pause longer, which keeps borrowing costs elevated for businesses and households planning capital decisions right now.
Home Sales Fell in June. Prices Hit an All-Time High. That Combination Has a Name.
June home sales disappointed as mortgage rates stayed elevated, even as the median home price reached a new record high. This is the classic affordability trap: prices rise because supply is tight, not because demand is strong, and the buyers who might otherwise bid prices back down have been locked out by monthly payment math. Sellers who bought at 3% mortgage rates have no incentive to move, which keeps inventory thin, which keeps prices elevated even as transaction volume falls. The market is frozen, not healthy.
Why it matters: A housing market with rising prices and falling sales is not creating wealth broadly. It is concentrating it among existing owners while shutting out first-time buyers and renters. For the broader economy, fewer home sales mean less spending on furniture, appliances, and renovation, a quiet drag on consumer spending that does not show up in housing price headlines but absolutely shows up in retail and discretionary spending data over the next two to three quarters.
USMCA Is Gone. The Trade Map Just Got Redrawn, and Nobody Has the New One Yet.
The Trump administration confirmed it will not renew the United States-Mexico-Canada Agreement, reopening negotiations with America’s two largest trading partners from a blank page. This is not a tariff adjustment or a tweak at the margins. USMCA governs roughly $1.8 trillion in annual trade, covering everything from auto parts and agricultural goods to energy and digital commerce. Operating without a framework creates a period of genuine uncertainty, where contracts, supply chains, and investment decisions rest on rules that may change mid-negotiation.
Why it matters: Supply chain uncertainty raises costs before it raises prices, because businesses respond by holding more inventory, diversifying suppliers, or delaying capital commitments until the rules are clear. That behavior is a quiet tax on efficiency. For any company with North American supply chains, and that is a very large share of U.S. manufacturing, the next 12 to 18 months will require planning for multiple trade scenarios simultaneously. That is not cheap.
The Framework: The Affordability Trap (Lock-In Effect in Housing)
The lock-in effect describes what happens when a large share of existing homeowners are sitting on mortgage rates so far below current market rates that selling becomes financially irrational. With 30-year fixed mortgage rates still well above 6% and millions of owners locked into rates at 3% or below from 2020 to 2022, listing a home means voluntarily trading a cheap monthly payment for an expensive one on the next purchase. So they stay put. Inventory stays low. Prices stay high. And would-be buyers face record prices financed at punishing rates, which explains exactly why June sales fell even as prices hit all-time highs. This is not a demand problem or a supply problem in the traditional sense. It is a rate-differential problem, and it does not resolve until either mortgage rates fall enough to make moving financially tolerable or enough forced selling (job changes, divorces, estate sales) unlocks inventory the market is not currently seeing. Until one of those conditions changes, the housing market will keep producing the same uncomfortable combination: high prices, low volume, and frustrated buyers on the sideline.
Our Take
The setup this week rhymes clearly with mid-1995, the last time the Fed held rates steady for an extended period after a tightening cycle while the bond market quietly repriced the long end higher without a clear inflation catalyst. Back then, the consensus said the economy was slowing into a soft landing. It was right, barely, but the path was bumpier than the calm yield curve suggested, and the gains that followed went almost entirely to investors who stayed in equities through the uncertainty. Here in July 2026, the 10-year Treasury yield has climbed to 4.54% while the 2-year sits at 4.16%, giving a spread of 0.35%. That is a positively sloped curve, which markets are treating as a green light. But the spread is narrow enough, and the Fed is stationary enough at 3.63%, that almost any upside inflation surprise could flatten it again fast. What the consensus is missing is the double distortion in the jobs data: the World Cup’s 40,000-job boost inflated June’s headline, and the USMCA uncertainty has not yet shown up in any economic data because businesses are still in wait-and-see mode. When that uncertainty starts crystallizing into actual hiring freezes and deferred capital spending, probably in the third quarter, the labor data will look softer in a way that catches rate markets off guard. The mechanism is straightforward: trade uncertainty raises the cost of planning, planning delays suppress investment, investment suppression is the first place job creation softens before it shows up in unemployment claims. Watch the August jobs report, due in early September, as the first clean read after the World Cup distortion fades. A number below 120,000 on adjusted payrolls would shift the calculus meaningfully. A number above 160,000 would tell you the underlying labor market is more durable than the bearish case assumes, and that the Fed’s holding pattern is exactly the right call.
What I’m Reading
The Lock-In Effect of Student Loans and Mortgages on Labor Mobility, National Bureau of Economic Research (NBER)
With the housing lock-in effect freezing inventory and distorting price signals, this NBER work on how debt structures reduce mobility is directly relevant to understanding why today’s housing market defies simple supply-and-demand analysis.
How Do Large Sporting Events Affect Local Economies?, Brookings Institution
Before accepting June’s payroll headline at face value, this Brookings analysis on the economic footprint of major sporting events gives essential context for separating temporary event-driven hiring from durable labor market strength.
Trade Policy Uncertainty and U.S. Manufacturing Investment, Federal Reserve Bank of New York
As USMCA negotiations reopen with no framework in place, this Fed research on how trade policy uncertainty translates into deferred capital spending is the clearest guide to the second-order effects markets are not yet pricing.
The Week Ahead
Consumer Price Index (CPI), June 2026 (Tuesday, 8:30 AM ET)
With the 10-year breakeven inflation rate sitting at 2.24%, a hotter-than-expected CPI print would challenge the bond market’s confidence that inflation is under control and could push yields meaningfully higher at exactly the wrong moment for the housing market and rate-sensitive borrowers.
Producer Price Index (PPI), June 2026 (Wednesday, 8:30 AM ET)
PPI leads CPI by one to two months, making this week’s producer price data the earliest look at whether USMCA uncertainty and Strait of Hormuz supply normalization are showing up in upstream cost pressures yet.
University of Michigan Consumer Sentiment, July Preliminary (Friday, 10:00 AM ET)
Five consecutive weeks of falling gasoline prices should be showing up in consumer confidence by now, and this preliminary read will tell us whether the pump-price relief is actually changing how households feel about the economy, which is the leading edge of consumer spending behavior.
Federal Reserve Beige Book (Wednesday, 2:00 PM ET)
The Beige Book’s qualitative, district-by-district reporting will be the first place to see whether USMCA uncertainty is translating into actual business caution on the ground, before it shows up in any hard data release.
Initial Jobless Claims (Thursday, 8:30 AM ET)
After a June jobs report distorted by World Cup hiring, weekly claims are the cleanest near-real-time signal of whether underlying labor demand is holding, softening, or accelerating into the second half of the year.
ON1010 Research is an independent publisher of economic education and is not a registered investment adviser, broker-dealer, or investment company. Nothing published by ON1010 constitutes investment advice, a recommendation to buy, sell, or hold any security, or a solicitation of any kind. All content is for informational and educational purposes only. ON1010 publishes under the publisher exemption recognized by Section 202(a)(11)(D) of the Investment Advisers Act of 1940 (Lowe v. SEC, 472 U.S. 181, 1985). Always consult a qualified financial professional before making any financial decision.
Free Research
The economy moves fast. We make sure you move faster.
Economic data, policy shifts, and market signals — delivered to your inbox.
Subscribe Free