
The Yield Curve Is Positive, But Just Barely
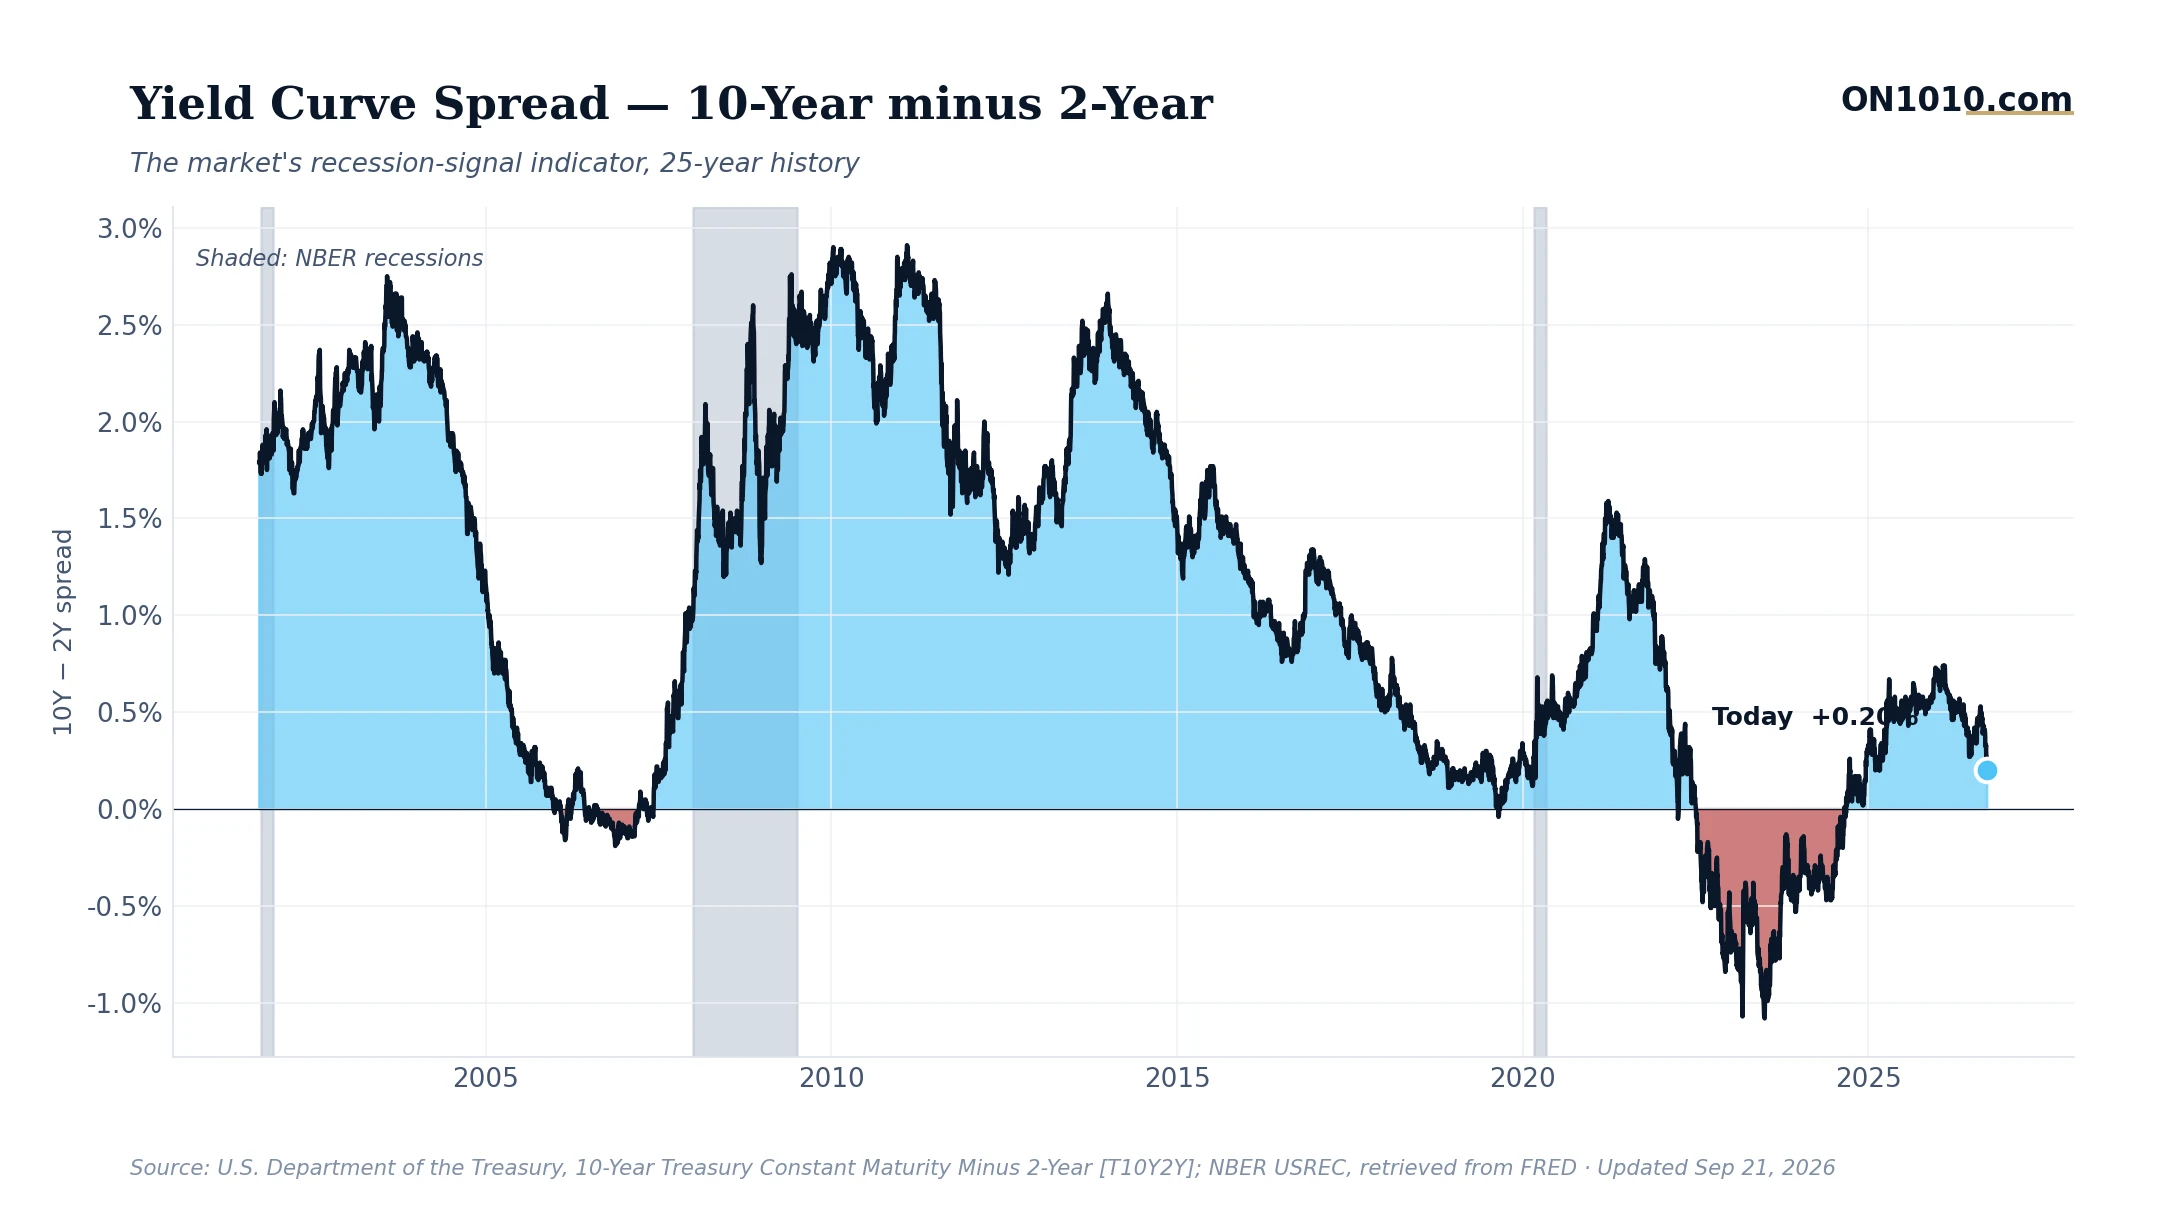
The gap between 10-year and 2-year Treasury yields narrowed to 0.20% on September 21, down from 0.25% just three days earlier. That is a 20% compression in less than a week, and it puts the spread at its slimmest positive reading in this recent stretch.
The Bigger Picture
The curve re-inverted and then slowly climbed back into positive territory earlier this year, and many took that as an all-clear signal. This week’s drift back toward zero complicates that story. The spread has fallen from 0.33% on September 15 to 0.20% today, a steady six-session compression that suggests bond markets may be revising something about their growth or rate expectations. Long-term rates are historically elevated, monetary policy sits near its historical midpoint, and core inflation remains unusually hot by historical standards. That combination tends to keep curves flat or inverted because the Fed has little room to ease without reigniting price pressure.
Why It Matters
Historically, a curve that re-enters positive territory and then quickly retreats back toward zero has raised questions about whether the initial recovery was durable or just a temporary reprieve. In past cycles, business operators and capital allocators have watched this spread closely because it shapes the incentive to lend: when short rates nearly match long rates, banks earn little for taking duration risk, and credit tends to tighten at the margins. Credit spreads are currently very tight by historical standards, which paints a picture of calm, but the yield curve and consumer sentiment (historically weak) are telling a different story. When major indicators disagree like this, the bond market’s signal usually deserves more weight, not less.
Bottom Line: The yield curve crawled back into positive territory a few months ago, and now it is quietly crawling back toward zero. The question is whether this is noise inside a recovery or an early signal that the recovery in the curve is stalling.
Source: Federal Reserve Economic Data (FRED)
ON1010 Research is an independent publisher of economic education and is not a registered investment adviser, broker-dealer, or investment company. This content is for educational and informational purposes only and is not investment advice or a recommendation to buy, sell, or hold any security. Published under the publisher exemption recognized by Section 202(a)(11)(D) of the Investment Advisers Act of 1940 (Lowe v. SEC). Always consult a qualified financial professional before making any financial decision.
Free Research
The economy moves fast. We make sure you move faster.
Economic data, policy shifts, and market signals — delivered to your inbox.
Subscribe Free