
The Yield Curve Is Positive. The Rest of the Dashboard Is Not.
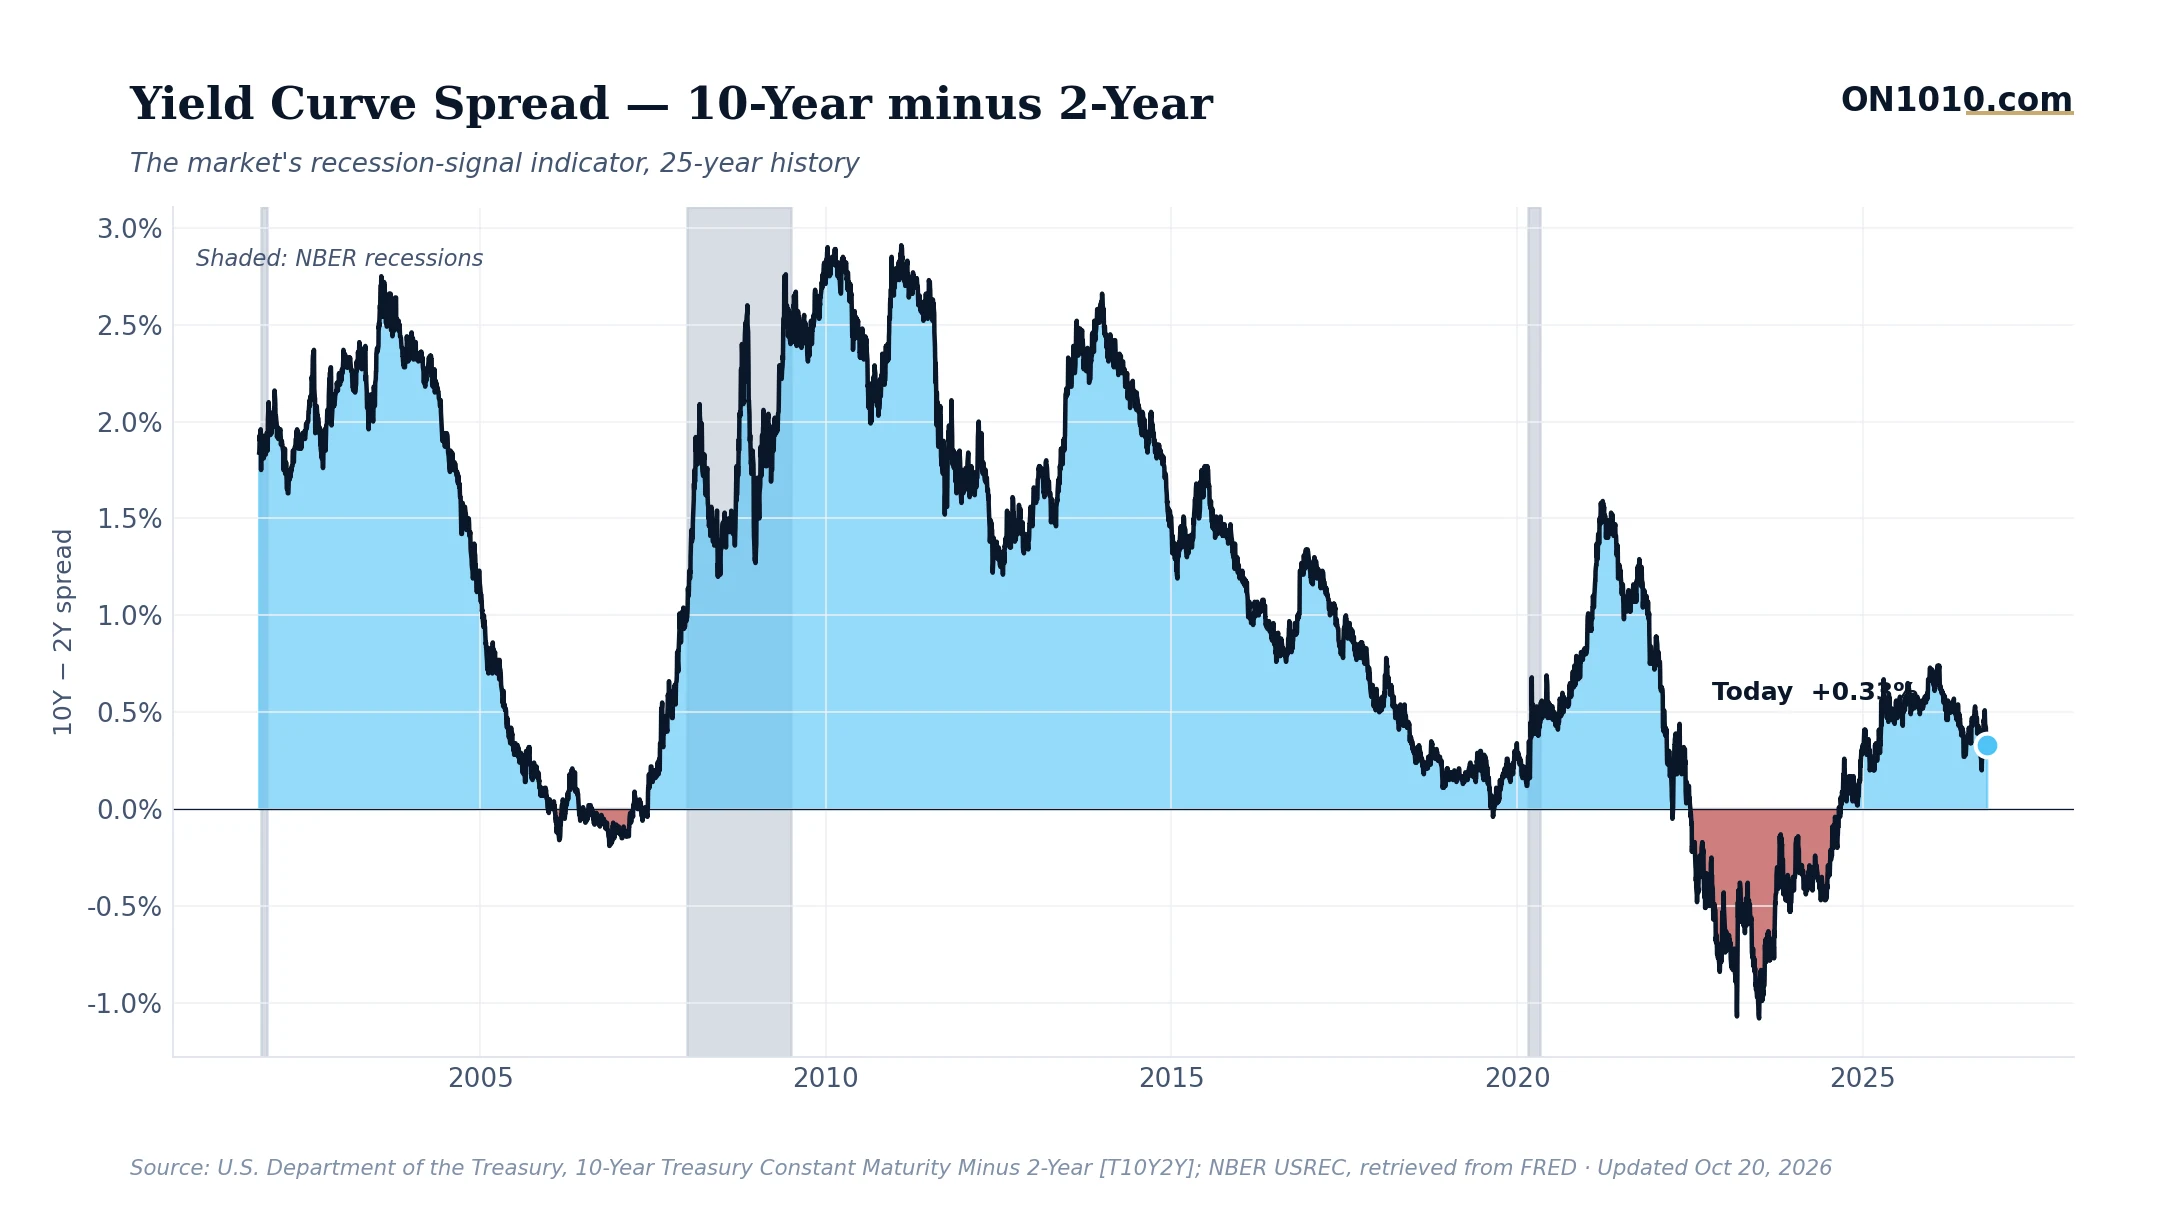
The gap between the 10-year and 2-year Treasury yield sits at 0.33% as of October 20, narrowing from 0.38% the prior session and from 0.42% just a week ago. The curve is still positive, which means long-term rates are higher than short-term rates. In the simplest terms, that is supposed to signal a healthy economy. The problem is almost everything else on the dashboard is pushing in the opposite direction.
Credit spreads just moved from elevated to very elevated. Market uncertainty jumped from near its historical norm to a level where, historically, a new recession began within the following 12 months about 21% of the time. Consumer staples and health care are outperforming the broader market by more than 4 percentage points over the past month, while technology, industrials, and financials all lag. Long-term interest rates remain high relative to history, in a zone where recessions followed about 20% of the time. The real policy rate is restrictive and rising. Inflation is still running hot. Growth is holding near its historical midpoint, but that gauge has been steady, not improving.
In past cycles, investors and capital allocators have watched the yield curve as a leading indicator because it reflects the market’s collective bet on where short-term rates will be in the future. A positive spread generally suggests the bond market expects rates to fall, which historically has accompanied easier credit conditions ahead. But when the curve is narrowing while credit stress is widening and institutional money is rotating toward defensive sectors, the two signals are telling different stories and that tension is worth taking seriously.
Historically, the yield curve alone clearing zero has been read as an “all clear” after an inversion. But the context around it matters just as much as the level. A curve that is positive and narrowing, inside a broader environment of tightening credit and rising uncertainty, has produced very different outcomes than one that is positive and widening in a recovering economy. The question for business owners and capital allocators is whether current conditions look more like the former or the latter.
Bottom Line: The yield curve says the storm may be passing. Credit markets and sector rotation say keep watching the sky.
Source: Federal Reserve Economic Data (FRED)
ON1010 Research is an independent publisher of economic education and is not a registered investment adviser, broker-dealer, or investment company. This content is for educational and informational purposes only and is not investment advice or a recommendation to buy, sell, or hold any security. Published under the publisher exemption recognized by Section 202(a)(11)(D) of the Investment Advisers Act of 1940 (Lowe v. SEC). Always consult a qualified financial professional before making any financial decision.
Free Research
The economy moves fast. We make sure you move faster.
Economic data, policy shifts, and market signals — delivered to your inbox.
Subscribe Free