
One sector runs. Seven don’t. Lenders want more money.
Technology Pulls the Index Higher. Lenders and Seven Sectors Refuse to Follow.
Here is the split screen. The S&P 500 sits above both its 50-day and 200-day moving averages, volatility is calm, and Technology has outrun the broader index by more than eight percentage points in a single month. On that surface reading, everything looks fine. But Financials have trailed the index by nearly eight points over the same stretch. Industrials and Communication Services are both underwater against SPY. Every defensive sector, from utilities to real estate to consumer staples, has lost ground to the index simultaneously. One sector is doing almost all the work, and the rest of the market is quietly stepping back.
At the same time, the bond market is sending a harder message. The 10-year Treasury yield has climbed from 4.96% to 5.24% in less than two weeks. Credit spreads, which measure the extra interest rate lenders charge to take on default risk, are wide and still widening. Lenders are not panicking, but they are asking for more compensation, which is what caution looks like before it becomes a headline. When equity markets say growth is fine and bond markets say credit conditions are tightening, one of them is wrong. Historically, bonds have resolved this kind of disagreement first.
In this brief: why narrow market leadership is a diagnostic, not just a market observation; what widening credit spreads mean for businesses carrying debt; and what the historical record says about how this kind of setup has typically resolved.
When One Sector Carries the Market, the Rally Is Borrowing Time.
Start with what the sector rotation is actually saying, because it is easy to misread.
The surface-level story is that offense is beating defense, which sounds like a healthy, risk-embracing market. But offense is a category with four sectors, and only one of them is actually working. Technology is up more than eight points against SPY over the past month. Financials are down nearly eight points against it. Industrials and Communication Services are both trailing. Every defensive sector is also lagging the index. So the real picture is not offense beating defense. It is Technology pulling the index higher while everything else drifts behind it.
Broad bull markets do not usually look like this. When the economy is genuinely expanding and businesses across industries are seeing better conditions, capital tends to spread. Industrials participate because companies are ordering equipment. Financials participate because loan demand is healthy and margins are widening. The fact that Financials are doing the worst of any offensive sector, in a period when credit spreads are rising, is a signal worth naming directly: lenders are telling a different story than the index is.
What Lenders Are Actually Saying
Credit spreads, the extra yield lenders demand above a risk-free Treasury to compensate for the chance a borrower defaults, are elevated and moving wider. Layered on top of a 10-year Treasury yield that has now climbed into territory it has occupied in fewer than one in four months over the past several decades, the all-in cost of borrowing for businesses is genuinely high by any historical standard.
The mechanism matters here. When rates are high and spreads are wide simultaneously, the companies that feel it first are not the large investment-grade firms with fixed-rate debt locked in years ago. Those businesses are largely insulated until their existing debt matures. The companies that feel it now are mid-market and smaller borrowers, the ones refinancing floating-rate facilities, taking on new credit lines to fund inventory, or raising capital for expansion. These businesses drive the majority of private-sector employment. Their margins get squeezed before any of it shows up in a GDP print.
This is how tight policy works with what economists call long and variable lags. The aggregate data looks fine while individual income statements quietly deteriorate. Hiring and investment decisions follow margins, and margins compress before revenues do.
The Historical Read on This Setup
We checked every month back to the early 1950s for conditions comparable to today: growth near its historical midpoint, inflation still running hot, monetary policy restrictive and still tightening, long-term rates in the upper range of their history. The closest analogs include October 1996, September 2017, and June 1995.
From those comparable setups, the following twelve months were positive about 80% of the time, above the all-history base rate of 74%. A new recession began within twelve months about 11% of the time, below the historical average of 15%. Those are constructive numbers, and they are worth having. But the honest caveat is this: our historical study has genuine skill at estimating recession risk, and nearly all of that skill comes from the yield curve. The yield curve, currently showing the 10-year yield at 0.46 percentage points above the 2-year, has just returned to positive territory after a long inversion. The re-steepening is real, but historically the period just after a yield curve un-inverts is when recession risk has sometimes crystallized rather than faded, because the re-steepening often signals that short-term rates are about to fall in response to slowing growth. This time, rates are rising from the short end too, which muddies that read. Both interpretations are defensible, and anyone telling you with confidence which one wins is working from conviction, not evidence.
What This Means for a Business Running Today
The question for someone committing capital right now is not whether the economy is in recession. It almost certainly is not. The question is whether the cost of sustaining operations and growth has risen enough to compress margins, and whether the financing you are counting on will still be available and affordable when you need it.
Consumer sentiment has climbed from near historic lows over the past several months, which is genuinely encouraging and has, historically, almost never been followed by a recession within the following year. But sentiment becoming spending requires that households can actually act on their improved mood, and a 30-year mortgage rate at 7.28% after climbing more than a full percentage point since summer is a real constraint on the biggest purchase most households make.
The economy is not breaking. The evidence does not support that conclusion. But the financing environment is tightening in ways that compress margins before they compress employment, and a market carried almost entirely by one sector's AI-driven optimism is a narrower foundation than the headline index level suggests. Those two facts together are worth building into your planning assumptions, whatever decisions your own situation calls for.
When one sector carries the entire market and lenders are simultaneously demanding higher compensation for risk, the economy may be fine on aggregate while individual balance sheets quietly absorb costs that will show up in margins before they show up in headlines.
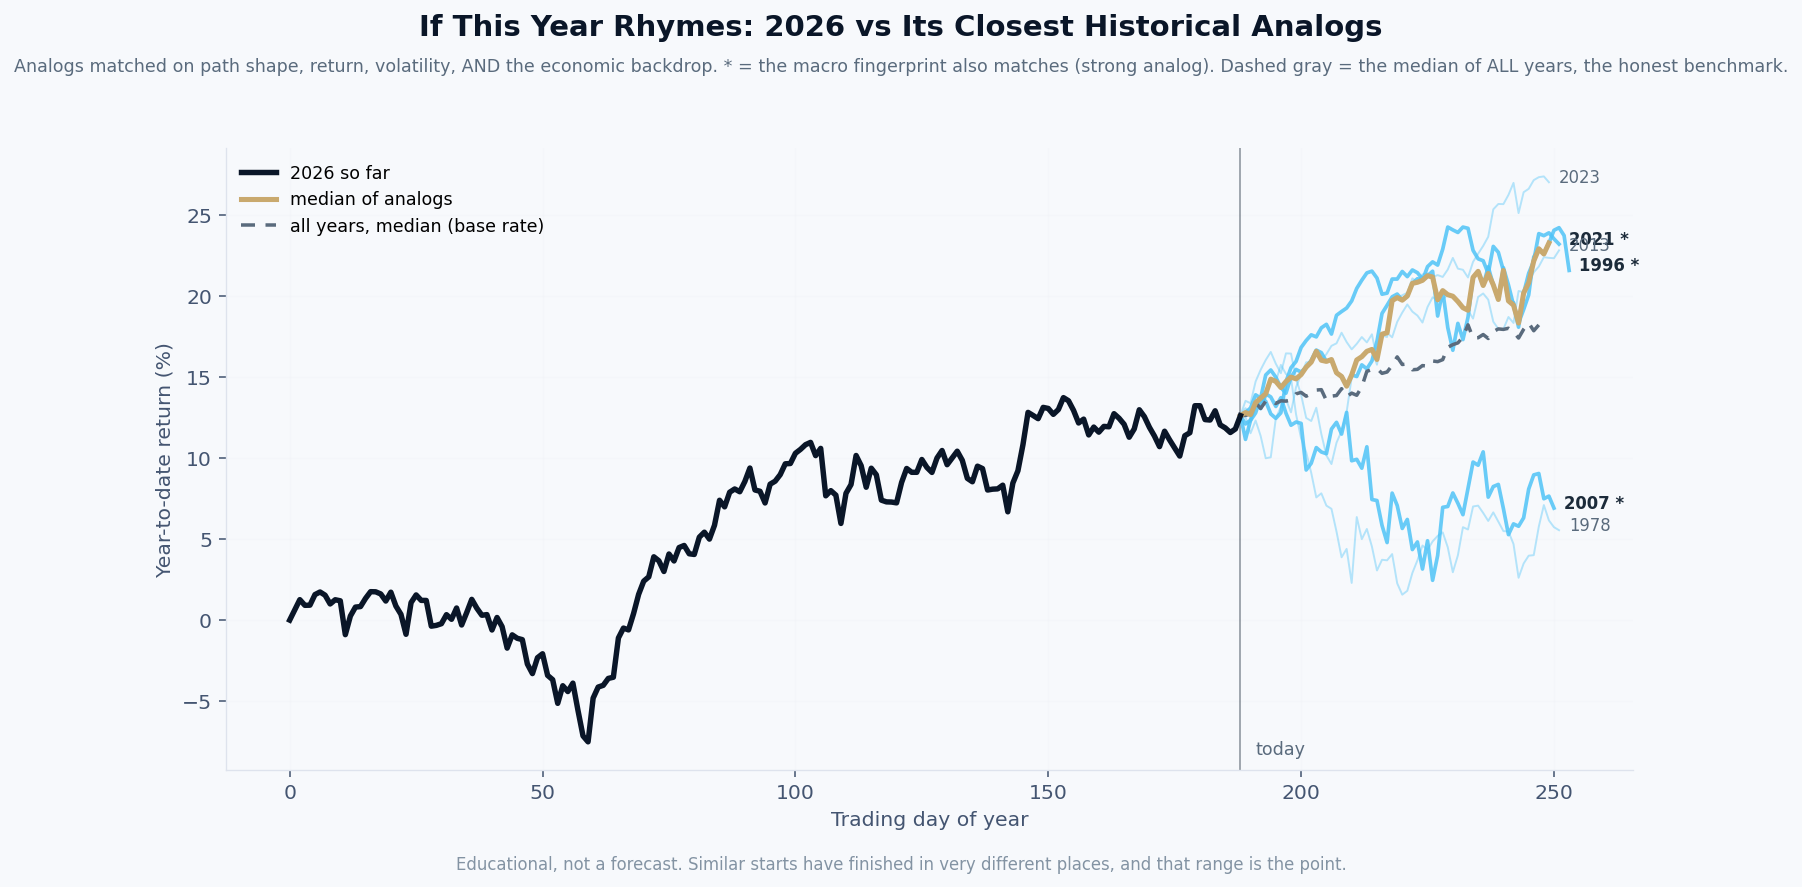
By this week's economic fingerprint, 2026 most closely resembles 2021, then 1996.
What it is. The black line is this year’s market path so far. Each colored line is a past year that our model ranks among the most similar to this one, matched on the shape of the path, its volatility, and the economic backdrop: inflation, interest rates, credit, employment, and more. A star means the economic fingerprint matches especially closely.
How it is built. Rebuilt every week from seventy years of data, using only information that was actually available at each point in history. The years are ranked by the model, not chosen by us.
What it is not. A prediction. Our own testing shows this tool has no ability to forecast where the market finishes the year, and we publish that finding on purpose. What it offers is context: the range of what followed similar setups, so a decision maker can plan for a range instead of betting on a point. The spread between those lines is usually the real lesson.
| Mon | No major scheduled releases; watch any Fed speaker remarks for signals on whether the September jobs miss changes the rate path calculus. |
| Tue | NFIB Small Business Optimism for September: a surprise drop would confirm that tighter credit conditions are hitting the businesses that drive most private-sector hiring before the big-company data catches up. |
| Wed | FOMC minutes from the September meeting: any language suggesting the committee debated pausing sooner than expected would take pressure off the short end of the yield curve and narrow the policy uncertainty that lenders are currently pricing. |
| Thu | Initial jobless claims: after a 29,000 payrolls print, a sustained move above 220,000 in claims would be the first hard evidence that the labor market is absorbing the rate environment rather than ignoring it. |
| Fri | Producer Price Index for September: if PPI comes in hotter than expected after a weak jobs report, the Fed faces the exact stagflation bind that has historically been hardest to navigate without breaking something in credit markets. |
Free Research
The economy moves fast. We make sure you move faster.
Economic data, policy shifts, and market signals — delivered to your inbox.
Subscribe Free