
Households are falling behind. The VIX is not buying it.
Households Are Falling Behind on Debt. The VIX Is Not Buying It.
Consumer sentiment is sitting near the lowest point in decades of survey history. Meanwhile, the VIX, which measures how much investors are paying to protect against market swings, just printed at 14.84, well below its recent average and squarely in the zone that historically signals complacency. These two readings describe completely different economies. One says households are under real financial pressure. The other says markets expect smooth sailing ahead.
Both cannot be fully right. Either the gloom is a lagging emotional reaction that will fade as incomes recover, or the calm is a mirage built on a narrow foundation that hasn't priced what's actually happening on household balance sheets. The Federal Reserve's own consumer finance survey, just released this week, adds a third data point: Americans' ability to service debt has deteriorated to levels not seen since the last major credit stress cycle. That is not a mood reading. That is a cash flow fact.
In this brief: which signal has historically been right when the two diverge like this, what the Fed's own household data reveals that the sentiment headline misses, and what the gap between a calm market and a stressed consumer means for anyone making hiring, pricing, or borrowing decisions right now.
Sentiment Falls. Lenders Grow Cautious. The VIX Sleeps Through Both.
Start with the basic tension. The S&P 500 is above both its 50-day and 200-day moving averages, the VIX is near a two-year low, and Technology stocks are running more than 4% ahead of the broader index. On the surface, this looks like a healthy bull market. But peel back one layer and the picture changes. Financials are running 6.4% behind the index. Industrials are down 3.5% versus SPY. Communication Services, 3.7% behind. One sector is carrying the index while seven others drift sideways or lower. A bull market where one sector does all the work is not the same animal as a bull market where gains are broad.
When One Sector Carries the Weight, Spread It Thin
This matters for business decision-makers in a specific way. Profit margins lead hiring and investment decisions. When margins are expanding broadly across sectors, firms across the economy feel confident enough to add headcount, commit to capital projects, and extend credit to customers. When margin expansion is concentrated in one sector, that confidence signal stays concentrated too. A CFO running an industrial business or a financial services firm is not reading the same margin story that a hyperscaler's board is reading right now. The index level flatters the distribution.
Sentiment data confirms this unevenness from the household side. We checked every comparable month back to the 1950s. When consumer sentiment has been this depressed, a recession began within the following year essentially zero percent of the time, and the indicator typically recovered. That is genuinely encouraging as a base rate. But here is the catch: those historical recoveries mostly happened when credit was loose and real interest rates were low. The structural regime today is different. The Fed's policy rate is still restrictive by any historical measure, long-term Treasury yields are sitting in the upper quarter of their entire post-war history at 5.22% on the 10-year, and credit spreads are wide enough that lenders are already pricing risk more conservatively than headline rates alone would suggest. The historical base rate was set under different conditions. Apply it carefully.
What the Fed's Own Household Survey Is Telling Us
The data point that connects these threads is the one getting the least attention this week. The Federal Reserve's Survey of Consumer Finances, the most comprehensive look at American household balance sheets produced anywhere, found that Americans' ability to meet debt payments has deteriorated to levels associated with past credit stress cycles. This is not a sentiment reading. People do not have to feel bad about their finances to show up in this survey; they have to actually be falling behind.
Here is the mechanism that makes this matter beyond households. Lower-income households spend a higher fraction of every dollar they earn. When their debt service costs rise, their spending falls first and fastest. Consumer spending is roughly two-thirds of US GDP. If the households most exposed to revolving debt and variable-rate obligations are cutting back, that pressure works its way into retail sales, services demand, and eventually into the revenue lines of businesses that serve them. High-income households own equities and largely own their homes outright or at fixed rates locked in before 2022. Their balance sheets look fine. The aggregate masks the distribution.
We also checked where this kind of setup historically resolves. The months most comparable to October 2026, measured by the combination of growth near its historical midpoint, inflation still hot but falling, and monetary policy restrictive, showed positive market returns over the following year about 81% of the time, above the long-run base rate of 74%. But our study also found that nearly all of its ability to anticipate economic turning points comes from the yield curve, not from sentiment or market levels. The yield curve today shows a 10-year minus 2-year spread of 0.44%: positive, recently returned from inversion, but still narrow. History says watch that spread carefully. When it widens durably, the refinancing math for businesses improves. When it stalls or reverses, the stress stays.
What a Business Owner Should Be Asking Right Now
The honest summary is this. The macro environment is not flashing recession, but it is not flashing all-clear either. Growth is running near its historical norm. Inflation is still high versus history, though softening. Real rates are restrictive. Household balance sheets are under genuine pressure at the lower end of the income distribution, and the markets pricing calm are being carried by a single sector.
For anyone making decisions about hiring pace, debt structure, or pricing power over the next 12 to 18 months, the right question is not whether the index is above its moving average. It is whether your customers sit closer to the household that owns Technology stocks or the household whose debt service just hit a stress-era reading. Those are two different demand stories, and right now they are both hiding inside the same aggregate number.
Consumer sentiment near historic lows and deteriorating household debt capacity are real cash flow facts, not mood readings, and they matter most for businesses whose customers are not the ones holding Technology stocks.
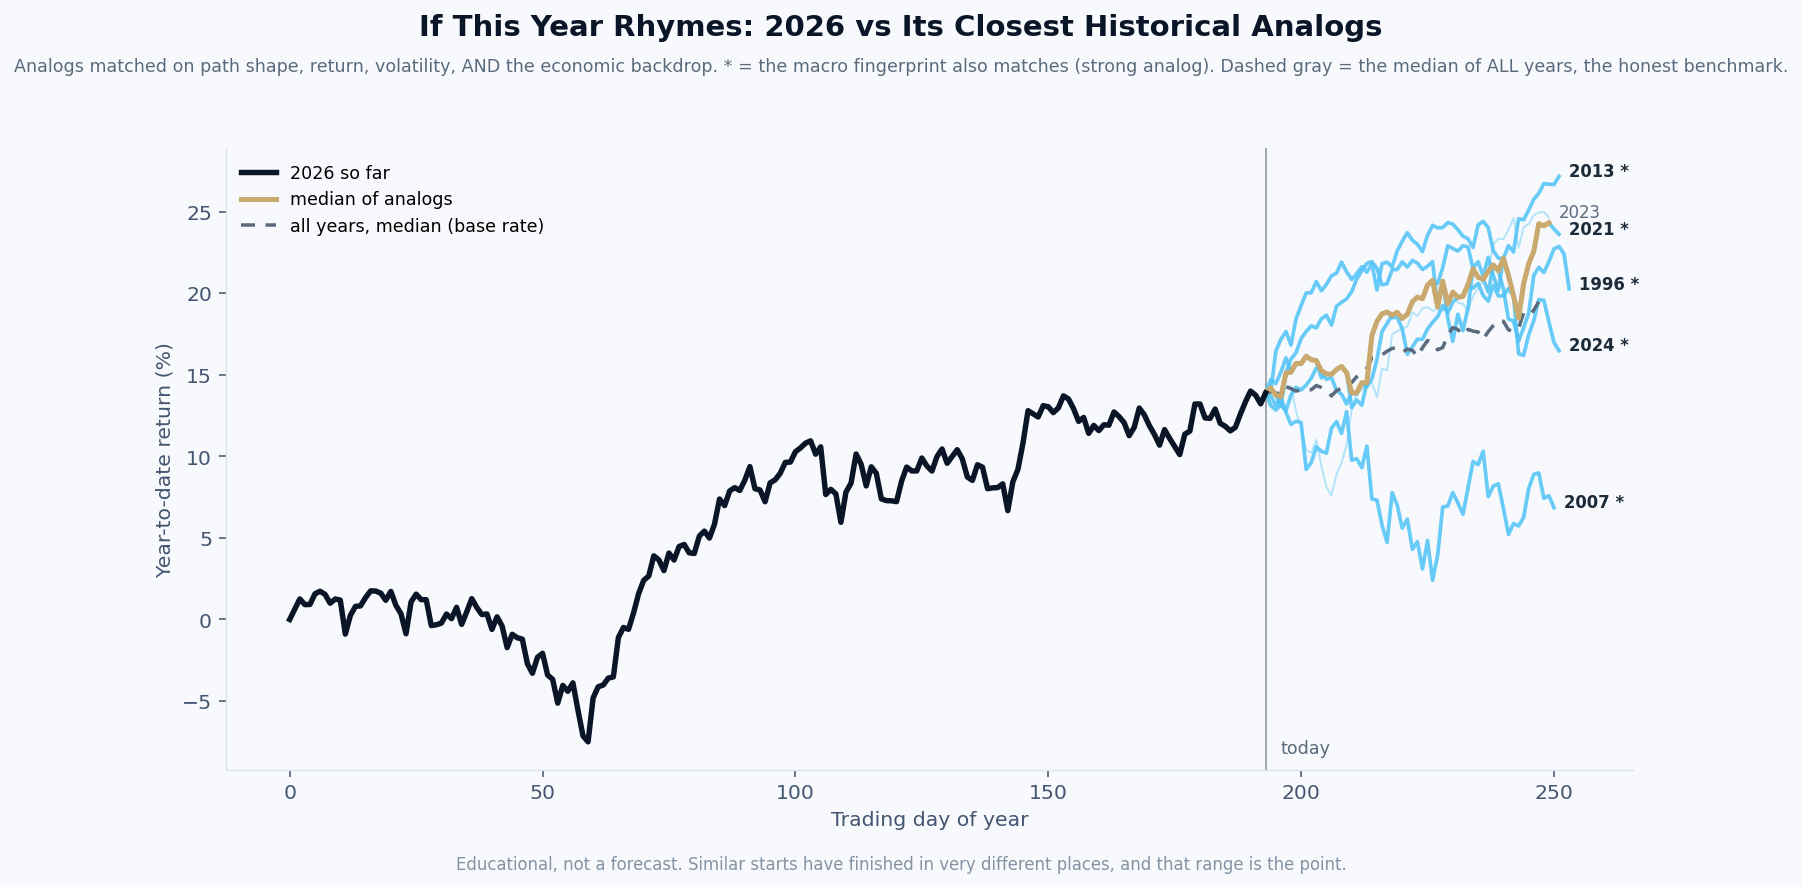
By this week's economic fingerprint, 2026 most closely resembles 2021, then 2013.
What it is. The black line is this year’s market path so far. Each colored line is a past year that our model ranks among the most similar to this one, matched on the shape of the path, its volatility, and the economic backdrop: inflation, interest rates, credit, employment, and more. A star means the economic fingerprint matches especially closely.
How it is built. Rebuilt every week from seventy years of data, using only information that was actually available at each point in history. The years are ranked by the model, not chosen by us.
What it is not. A prediction. Our own testing shows this tool has no ability to forecast where the market finishes the year, and we publish that finding on purpose. What it offers is context: the range of what followed similar setups, so a decision maker can plan for a range instead of betting on a point. The spread between those lines is usually the real lesson.
| Tue | September CPI: if core inflation surprises above 3%, the case for any Fed rate cut before mid-2027 effectively closes, and the refinancing math for variable-rate borrowers gets worse. |
| Wed | September PPI: producer prices feed into corporate margins with a lag, so a hot read here means the margin compression that leads to hiring slowdowns may still be working its way through the pipeline. |
| Thu | Initial jobless claims: claims have been running below 200,000, a sign of genuine labor market strength; a sustained move above that threshold would be the first clean signal that the household balance sheet stress is reaching employment decisions. |
| Thu | September retail sales: the single fastest read on whether lower-income households are actually cutting back spending, which is the transmission mechanism from balance sheet stress to GDP that this week's argument turns on. |
| Fri | University of Michigan consumer sentiment (preliminary): the direction of the next read matters more than the level, a further decline while markets stay calm would deepen the divergence this brief is tracking. |
Free Research
The economy moves fast. We make sure you move faster.
Economic data, policy shifts, and market signals — delivered to your inbox.
Subscribe Free