
The jobs number looked great. The wages did not.
162,000 Jobs. One Problem: The Paychecks Are Losing to the Pump.
August's jobs report hit like a surprise: 162,000 new jobs, more than three times what forecasters expected. Oil is above $90 a barrel after Iran struck U.S. allies in the Gulf. The 10-year Treasury yield is sitting at 4.77%, its highest sustained level in years. And yet lenders are charging almost nothing extra to take on risk, credit spreads are historically tight, the kind of calm that usually means nobody in the bond market is panicking. So which is it? A resilient economy powering through war, inflation, and high borrowing costs? Or a surface that is holding while the underneath quietly cracks?
The inflation data makes the puzzle harder to solve. Core inflation is running hotter than roughly nine of every ten months in the postwar record. Average hourly earnings rose 2.44% over the past year, which sounds like a raise until you remember that gas at the pump costs 30% more than it did a year ago. The paycheck went up. Purchasing power did not, at least not by much. Meanwhile, workers are quitting their jobs at the slowest pace in recent memory, which historically means one thing: people are staying put because they are not confident something better is waiting.
In this brief: why the jobs number is more complicated than the headline, what wages are really doing after inflation, and what the bond market's unusual calm might be missing.
Strong Payrolls, Weakening Paychecks: Labor Is Not as Healthy as It Looks
The August jobs number was genuinely surprising. Economists had penciled in about 53,000 new jobs. The economy delivered 162,000. On a slow-news Friday, that kind of beat moves markets and makes front pages. But a jobs number on its own is like reading only the revenue line on an income statement. The number of jobs tells you activity is happening. It does not tell you whether the people working those jobs are getting ahead.
The Wage Number Sounds Better Than It Is
Average hourly earnings came in at $37.75 in August, up 2.44% over the prior year. In normal times, a 2.44% raise is respectable. These are not normal times. Retail gasoline averaged $4.07 a gallon this week, up roughly 30% from a year ago. Natural gas, which heats homes and generates electricity, costs more than it did twelve months back. The Bureau of Labor Statistics measures something called real wages, that is, how much your paycheck actually buys after accounting for rising prices. When you do that math, the 2.44% nominal gain shrinks fast. Workers are earning more dollars. They are buying less with them. That gap has been running for most of 2026, and it matters because consumer spending accounts for roughly two-thirds of the American economy. A household that feels squeezed does not spend the same way as a household that feels flush.
The quit rate makes this concrete. In July, 3.056 million workers voluntarily left their jobs, the sharpest single-month drop in recent memory. When workers quit freely, it signals confidence: they believe they can find something better. When they stop quitting, it usually means they have looked around and decided to stay put. That is not the behavior of a labor market where workers feel they have the upper hand. It is the behavior of a labor market where caution is setting in.
Hiring Slows, Openings Hold: A Labor Market Sending Mixed Signals
Here is where the data gets genuinely complicated. Job openings actually ticked up to 7.27 million in July, firms are still advertising for workers. But total hires fell to 5.054 million, the lowest reading in five months. Openings rising while actual hiring falls is an unusual combination. It can mean companies are posting positions they are not sure they want to fill, or that workers and employers cannot agree on terms. Either way, the spread between intention and action in the labor market widened. That is worth watching, because when businesses defer hiring decisions, payroll growth eventually follows downward.
What the Bond Market's Calm Is, and Is Not, Telling You
Credit spreads, the extra interest lenders charge on riskier loans above what the government pays, are historically tight right now. That is the bond market's way of saying: we are not worried about a wave of defaults. Lenders are still willing to extend credit without demanding a large premium for the risk. That is a genuine sign of system health, and it deserves respect. The yield curve has also healed: the 10-year Treasury at 4.77% yields 0.41 percentage points more than the 2-year at 4.34%, a gap that turned positive only recently after an extended period where short rates exceeded long ones, a configuration that has historically preceded economic slowdowns. The return to a positive slope is encouraging.
But here is the honest tension. The 10-year breakeven inflation rate, the bond market's own forecast for average inflation over the next decade, just edged up to 2.35%. The Fed's stated target is 2%. That 0.35-point gap may look small, but it tells you bond investors are not fully convinced inflation returns to target. And with oil above $90 a barrel after an escalation in the Middle East, the pipeline for additional price pressure is open. Mortgage rates pushed back up to 6.71% this week on the oil-driven rate spike. Businesses planning capital projects and households deciding whether to buy a home both face a borrowing environment that is meaningfully tighter than it was two years ago.
We have checked every comparable macro setup going back to the 1950s. From environments where growth was near its long-run midpoint, inflation was running hot, rates were elevated, and credit was calm, the following twelve months were positive roughly 80% of the time, above the historical average. That is the constructive case, and the data supports it. But in about one in five comparable periods with long rates at these levels, a new recession began within twelve months. Those two facts can both be true. The base rate favors continued expansion. The margin for error is narrower than the headline jobs number implies.
The jobs number looks strong, but wages are losing ground to inflation, workers are staying put out of caution rather than confidence, and the real test of this economy is whether margins can hold as borrowing costs stay elevated.
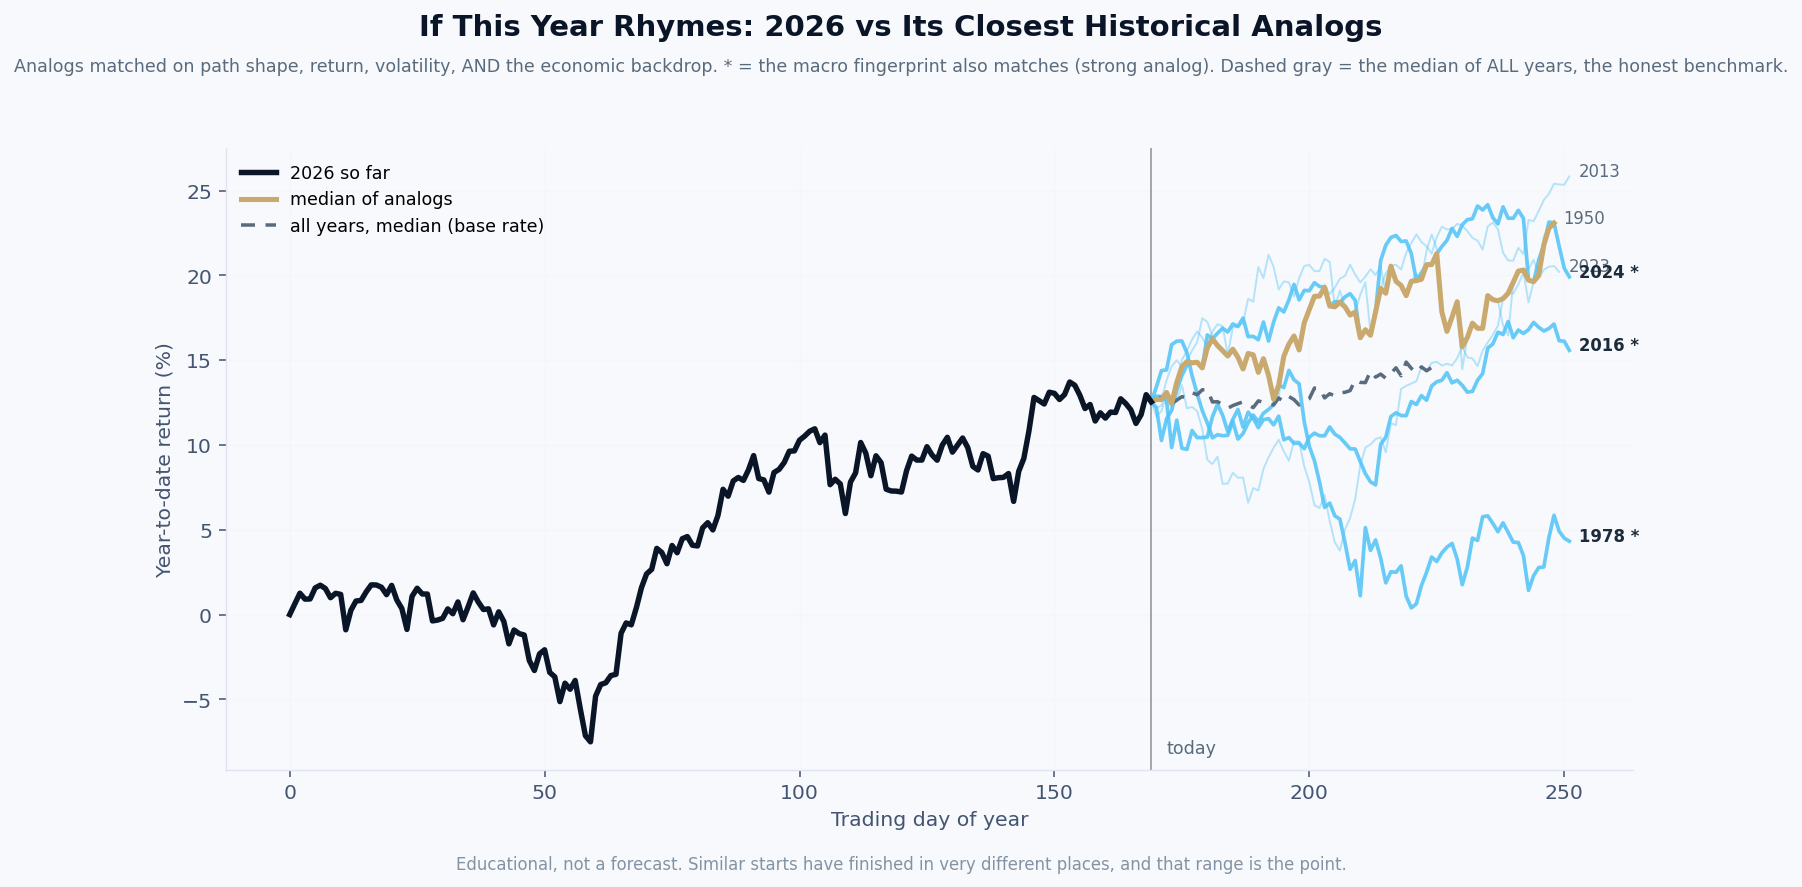
By this week's economic fingerprint, 2026 most closely resembles 2023, then 1978.
What it is. The black line is this year’s market path so far. Each colored line is a past year that our model ranks among the most similar to this one, matched on the shape of the path, its volatility, and the economic backdrop: inflation, interest rates, credit, employment, and more. A star means the economic fingerprint matches especially closely.
How it is built. Rebuilt every week from seventy years of data, using only information that was actually available at each point in history. The years are ranked by the model, not chosen by us.
What it is not. A prediction. Our own testing shows this tool has no ability to forecast where the market finishes the year, and we publish that finding on purpose. What it offers is context: the range of what followed similar setups, so a decision maker can plan for a range instead of betting on a point. The spread between those lines is usually the real lesson.
| Tue | NFIB Small Business Optimism for August: a jump would suggest Main Street is shrugging off higher borrowing costs, while another decline would reinforce the caution showing up in the quit rate. |
| Wed | CPI for August: the most important release of the week, if core inflation comes in hotter than expected, the case for near-term Fed rate cuts weakens further and mortgage rates likely push higher. |
| Thu | PPI for August: producer prices are the early warning for where consumer prices go next, so an upside surprise here would make the CPI print look like an undercount. |
| Thu | Initial jobless claims: the weekly pulse check on layoffs, a sustained rise above 250,000 would be the first real crack in the labor market resilience story. |
| Fri | University of Michigan Consumer Sentiment for September: sentiment is historically depressed but ticking up, whether households grow more or less pessimistic alongside a 30%-higher gas price is a direct test of the income-squeeze thesis. |
Free Research
The economy moves fast. We make sure you move faster.
Economic data, policy shifts, and market signals — delivered to your inbox.
Subscribe Free