
AI is holding the market up. The rest is slipping.
AI Is Holding the Index Up. The Rest of the Market Is Slipping.
On the surface, markets look healthy this week. The S&P 500 sits above both its 50-day and 200-day moving averages, a technical setup that historically has preceded continued gains more often than not. The VIX, which measures how much investors are paying for insurance against a drop, is below 15 and falling. Credit spreads, the extra interest rate that lenders demand to take on risk, are near the tightest they have been in years. By almost every broad measure, markets are signaling calm.
But look inside the rally and a different picture emerges. Technology is outperforming the broad market by 6.5% over the past month. Financials and Industrials, the two offensive sectors most tightly linked to actual economic activity, are each lagging the market by more than six points. Real Estate is down 8% relative to the index. Utilities are down nearly 10%. The sectors that rise when the economy is broadly healthy are being left behind by the one sector that runs on AI capital spending and does not need a healthy consumer to grow. One sector is doing the work of four, and the other three are quietly retreating.
In this brief: what narrow market leadership has meant historically, why the AI economy and the main-street economy are increasingly running on separate tracks, and what that split means for anyone making a capital commitment right now.
One Sector Is Carrying the Market. History Says to Notice.
There is a version of this week's story that sounds straightforwardly bullish. Nominal GDP is growing near 7% annualized. Initial jobless claims fell below 200,000 again, continuing a trend that puts the labor market roughly 15% stronger than a year ago by that measure. Consumer credit is still flowing. The equity index itself is in a confirmed uptrend. Read the headlines and everything looks fine.
The mechanism worth understanding is why the headlines can be right and the detail can still be warning you.
When One Theme Carries the Index
The S&P 500 is a market-capitalization-weighted index, which means the biggest companies contribute the most to its moves. When technology companies grow fast and their share prices rise, the index rises with them, even if the remaining four hundred and ninety companies are going nowhere. That is not a flaw in the design. It is simply a mathematical fact about how the index is constructed.
The problem arises when investors read the index as a report card on the whole economy. Right now, it is closer to a report card on AI capital spending. Technology is outperforming the broad market by 6.5% over the past month. Financials are lagging by 6.5%. Industrials are lagging by 6.2%. Real Estate is down 8% relative to the index. These are large gaps, and they do not resolve the same direction.
Financials and Industrials are worth watching specifically because they tend to move with economic throughput: when banks are lending actively and industrial companies are booking orders, both sectors typically rise. When both are lagging a rising index simultaneously, it suggests the growth story is narrower than the index level implies.
The Two-Economy Problem
The expert analysis informing our read this week describes the US economy as running on two parallel tracks. The AI sector is genuinely booming. Capital spending on AI infrastructure has roughly doubled year over year. The firms at the center of that boom are largely insensitive to high interest rates because their expected returns are high enough that borrowing costs barely register in the math. For them, the 10-year Treasury yield sitting at 5.18%, its highest level in recent history, is a minor friction at most.
For everyone else, that yield is a real cost. The 30-year mortgage rate crossed back above 7% this week. Businesses carrying floating-rate debt or facing refinancing in the next 12 to 18 months are doing the math against a rate environment that sits in the upper range of the past 50 years. Consumer sentiment is near the lowest it has been in the entire recorded history of the surveys, and while historically that level of gloom has not reliably predicted recessions, it does reflect something real: households are comparing today's prices with what they paid three years ago, and the cumulative increase is about 28% since early 2020. Wages grew faster than that in aggregate, up about 35%, but the level shock lingers in a way the rate-of-change numbers do not capture.
This is the distribution problem hiding inside the aggregate data. The economy in total looks stable. The AI-adjacent economy looks genuinely strong. The middle-market, rate-sensitive, consumer-facing economy is under measurable pressure.
What We Tested
We checked every comparable month back to the mid-1970s, looking for periods that resembled the current setup across growth, inflation, credit, and monetary policy. The months that matched most closely were late 1996, mid-2017, and mid-1995. From those starting points, the following 12 months were positive about 80% of the time, modestly above the all-history base rate of 74%. The forward recession probability from this zone runs about 11%, below the long-run base rate of 15%.
That is genuinely reassuring on the recession question. The honest addition is that our study carries no edge predicting 12-month market returns specifically, and the base rate shifts if narrow leadership fails to broaden. When one sector does the work of four, the index can still rise. But historically, durable bull markets have eventually required participation from the sectors that move with real economic activity, not just the ones running on a single theme.
The question this raises for anyone committing capital: are you investing in the AI economy, the main-street economy, or some combination of both? The answer to that question is doing more work in 2026 than sector allocation has done in most years. A qualified financial professional who knows your specific situation is the right person to help you think through what that split means for your own balance sheet.
Technology is carrying the index while Financials, Industrials, and Real Estate quietly fall behind, which means the market's calm surface is a report on one theme, not a verdict on the whole economy.
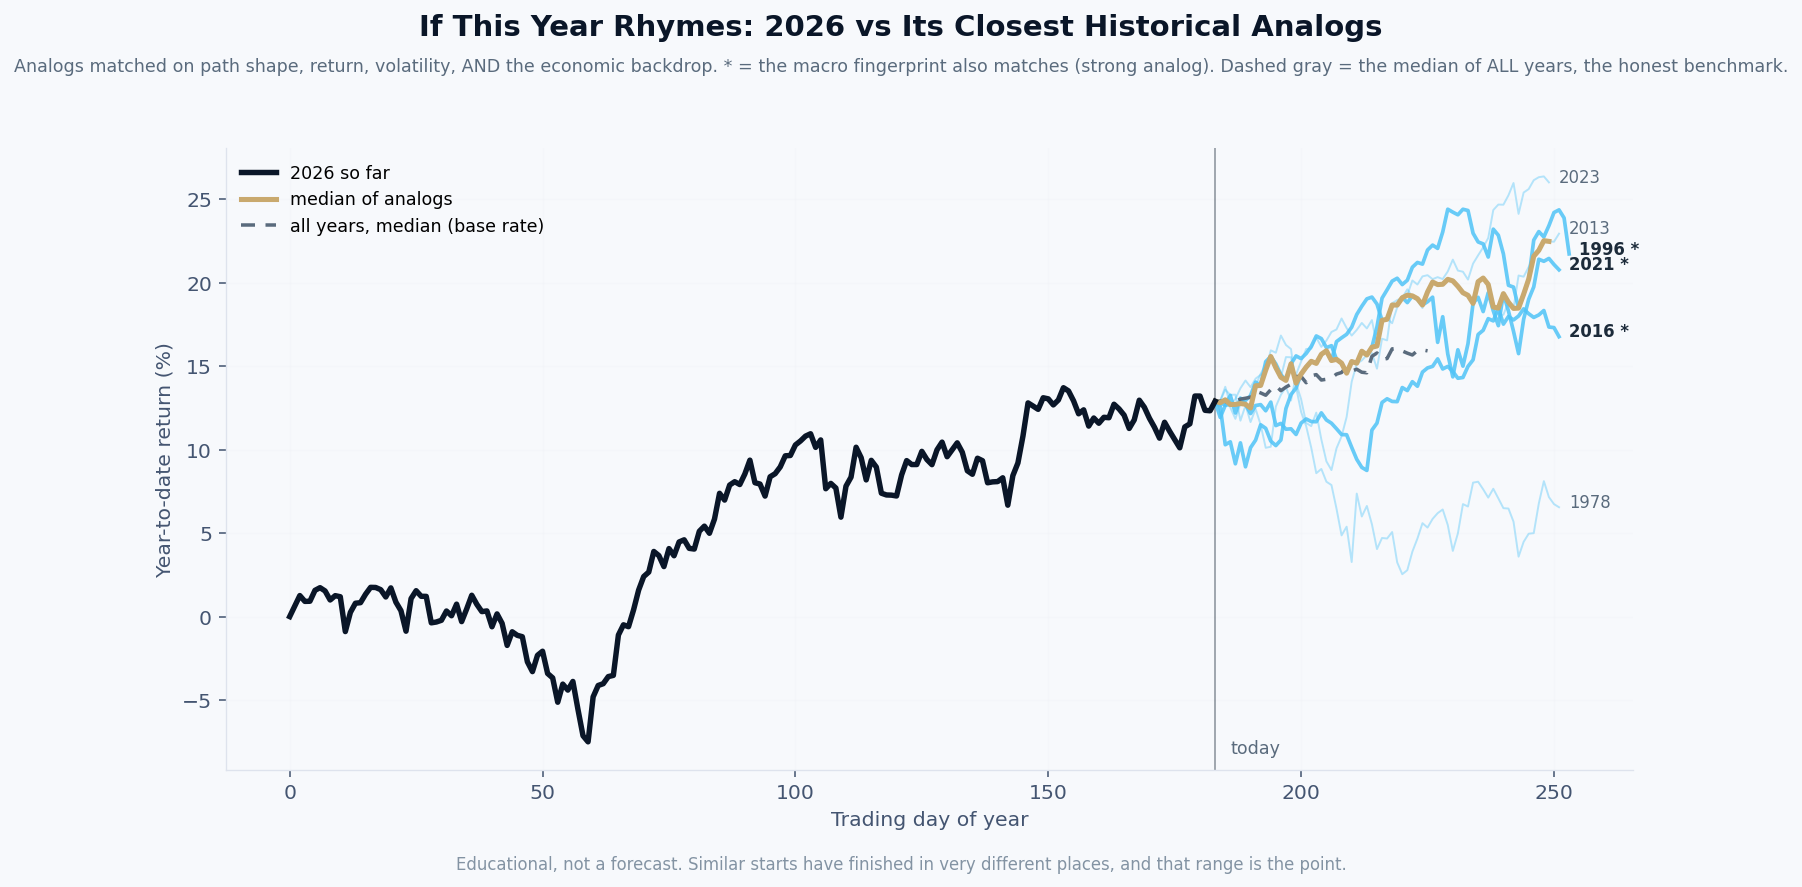
By this week's economic fingerprint, 2026 most closely resembles 2023, then 2021.
What it is. The black line is this year’s market path so far. Each colored line is a past year that our model ranks among the most similar to this one, matched on the shape of the path, its volatility, and the economic backdrop: inflation, interest rates, credit, employment, and more. A star means the economic fingerprint matches especially closely.
How it is built. Rebuilt every week from seventy years of data, using only information that was actually available at each point in history. The years are ranked by the model, not chosen by us.
What it is not. A prediction. Our own testing shows this tool has no ability to forecast where the market finishes the year, and we publish that finding on purpose. What it offers is context: the range of what followed similar setups, so a decision maker can plan for a range instead of betting on a point. The spread between those lines is usually the real lesson.
| Tue | Conference Board Consumer Confidence for September: if it falls further from already historically depressed levels, that would deepen the gap between what households say they feel and what aggregate data says the economy is doing. |
| Wed | ADP Private Payrolls for September: a surprise to the downside would be the first sign that the labor market's unusual strength is finally meeting the headwind of high rates and narrow growth. |
| Thu | Initial Jobless Claims: claims have been below 200,000 five times recently, a level consistent with a genuinely tight labor market; any sustained move higher would start changing that read. |
| Fri | September Nonfarm Payrolls and the Unemployment Rate: the headline number matters less than the hours-worked figure, which is what tells you whether economic throughput is actually rising or just redistributing existing jobs. |
Free Research
The economy moves fast. We make sure you move faster.
Economic data, policy shifts, and market signals — delivered to your inbox.
Subscribe Free