
Inflation near a historic high. Lenders pricing a historic low.
Inflation Is Near a Historic High. Lenders Are Pricing a Historic Low.
The Federal Reserve raised its benchmark rate to a target range of 3.75% to 4.0% this week, and Chair Kevin Warsh used one word to explain it: resolute. Bond markets briefly touched 5% on the 10-year Treasury before pulling back to 4.94%. Gas is at $4.32 a gallon, import prices are up 7.1% year over year, and core inflation is running hotter than roughly nine of every ten months in the modern record. By any reasonable reading, this is an economy where lenders should be demanding a premium to take on risk.
They are not. Credit spreads, the extra yield lenders charge borrowers above the risk-free rate, sit near the lowest levels in decades. The VIX, Wall Street's measure of expected volatility, is falling. Technology stocks are outperforming the broad market. On the surface, the credit and volatility markets are pricing something close to a soft landing with no turbulence. Underneath, inflation is still running hot, long-term rates are in their upper historical range, and the sectors that move when real capital investment is actually happening, industrials and financials, are both lagging the index. The question worth asking this week is simple: which market is telling the truth?
In this brief: why the calm in credit markets may be a liquidity story rather than an economic verdict, what history says about high-inflation periods when lenders stay relaxed, and what the divergence between the headline tape and the real-economy sectors beneath it is actually signaling for businesses making capital decisions now.
Credit Is Calm. Inflation Is Not. History Settles This Awkwardly.
Start with the pairing, because it is genuinely unusual. Core inflation has been hotter than roughly nine of every ten months in the recorded history of the modern US economy. At the same time, credit spreads, the extra yield corporate borrowers must pay above Treasury rates, sit near their lowest levels in decades. Those two readings almost never appear together, and when they do, the combination tends to be unstable. One of them eventually moves toward the other.
What tight credit spreads are actually saying
When lenders charge almost nothing extra to extend credit to businesses, they are expressing confidence: confidence that loans will be repaid, that margins will hold, that the economic trajectory is sound. Tight spreads are not irrational. The economy is growing. The Atlanta Fed's real-time GDP tracker put Q3 growth somewhere between 4.0% and 4.7% annualized. Retail sales jumped 1.24% in August alone. Jobless claims fell to 196,000 this week, the lowest reading in months. Lenders have genuine reasons to feel calm.
But there is a mechanism worth understanding: when AI-related borrowers, the hyperscalers building data centers and compute infrastructure, are raising enormous sums in public markets, ordinary borrowers get pushed into the banking system, where credit is still available at relatively modest premiums. The result is tight spreads economy-wide even as the cost burden is being distributed unevenly. Businesses outside the AI supply chain are paying more to borrow than the spread numbers imply, because the headline figures are being anchored by the strongest credits.
Where the market is quietly flagging doubt
The equity surface reads constructive. SPY is above both its 50-day and 200-day moving averages, and the broad rotation picture leans toward growth. Technology is up about 4 percentage points relative to the index over the past month. But pull one layer deeper and a different story appears. Industrials are down roughly 6 percentage points versus SPY over that same period. Financials are negative. Only two of four offensive sectors are actually outperforming the index.
Industrials matter here specifically because they are the economy's physical-investment sector: machinery, transportation, construction equipment, capital goods. When they lag in a nominally risk-on tape, the market is quietly saying something about real-economy conviction that the headline number does not. It is the difference between an economy being carried by one concentrated trade and an economy where capital is flowing broadly. They look the same in the index. They feel very different on the ground.
What history says about this combination
We checked every comparable month back to the early 1950s and found something worth knowing. From high-inflation readings like the current one, a recession within the following year happened only about 3% of the time historically. So this is emphatically not a recession call. But from months where long-term interest rates also sat in their upper historical range, as they do now at 4.94% on the 10-year, recession materialized within a year about 19% of the time. Combine hot inflation with high long rates and you have a cost-of-capital environment that historically pressures margins before it pressures employment, and margins lead everything else.
For businesses, the practical implication runs through the balance sheet. A company refinancing debt today is paying a rate that is high by historical standards, against an inflation environment that keeps nominal revenues elevated but eats real purchasing power. The spread between those two things, what you earn in nominal terms versus what you pay to finance the business, is the real margin. That spread is narrowing in ways the VIX and credit markets are not yet reflecting.
Bottom Line: The credit market's calm is real, but it is being sustained by AI-driven liquidity and strong aggregate growth numbers that mask an uneven distribution. Inflation this hot, rates this high, and industrial-sector breadth this soft is a combination that historically has resolved not through a crash but through a slower, quieter compression of margins in businesses outside the sectors drawing the most capital. The question for anyone making financing or pricing decisions over the next twelve months is whether their plan is built for the headline economy or the one underneath it.
Credit markets are pricing calm, but inflation this persistent and long rates this high have historically compressed margins in the real economy well before the headline numbers show any stress.
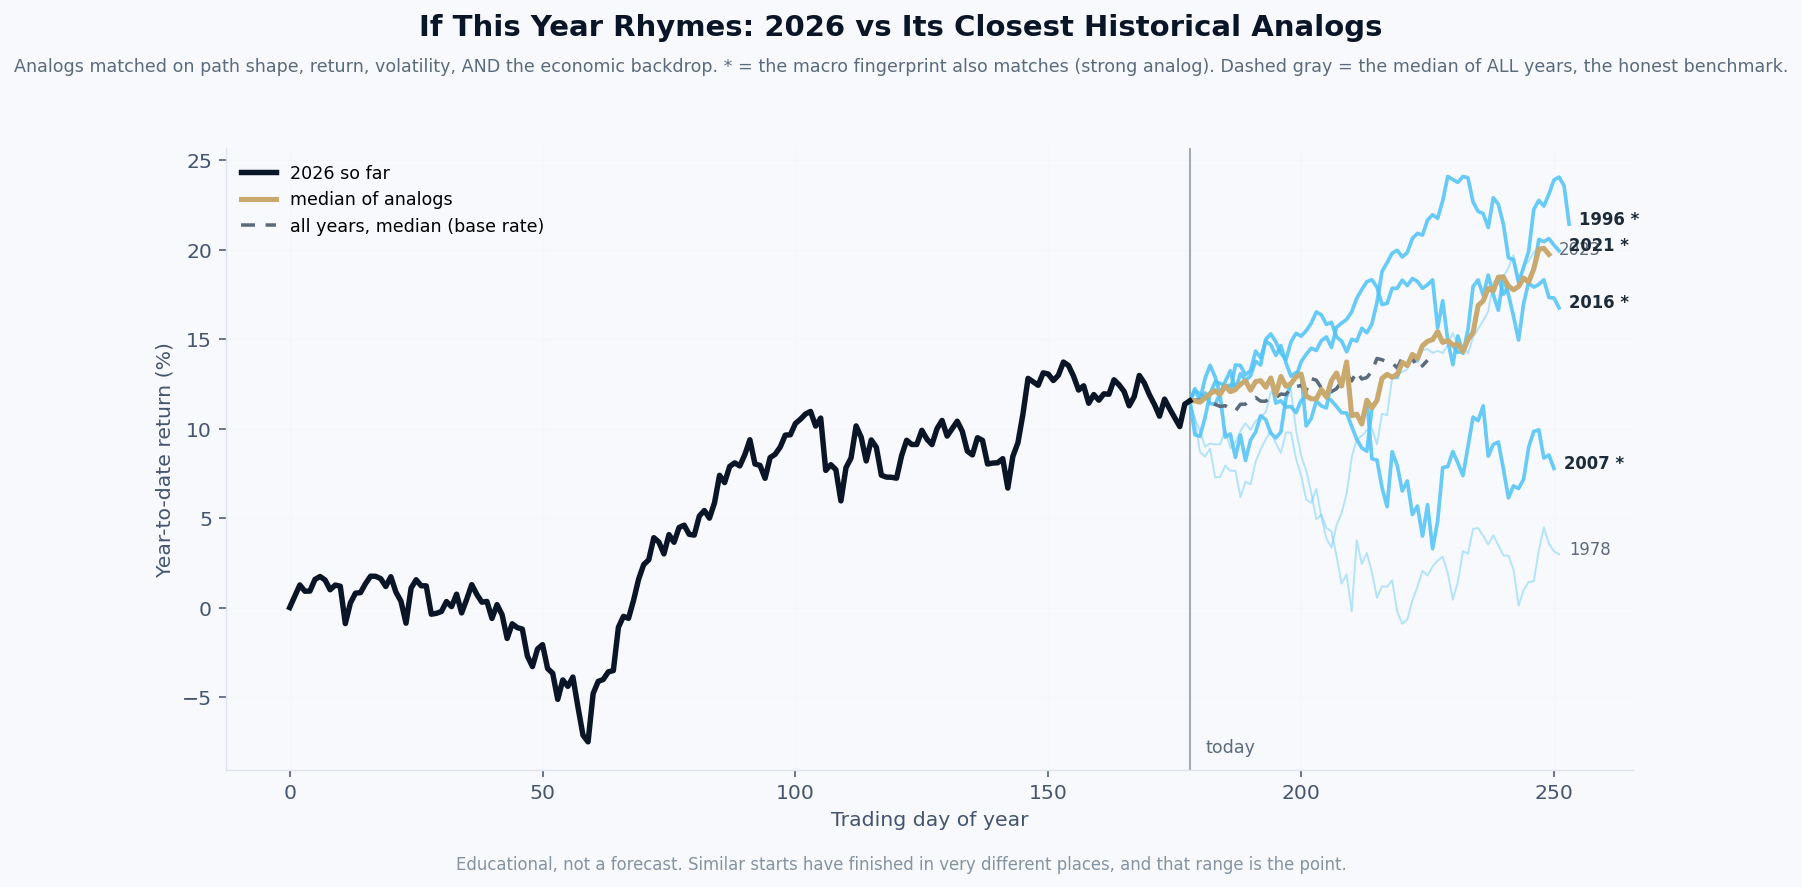
By this week's economic fingerprint, 2026 most closely resembles 1978, then 2023.
What it is. The black line is this year’s market path so far. Each colored line is a past year that our model ranks among the most similar to this one, matched on the shape of the path, its volatility, and the economic backdrop: inflation, interest rates, credit, employment, and more. A star means the economic fingerprint matches especially closely.
How it is built. Rebuilt every week from seventy years of data, using only information that was actually available at each point in history. The years are ranked by the model, not chosen by us.
What it is not. A prediction. Our own testing shows this tool has no ability to forecast where the market finishes the year, and we publish that finding on purpose. What it offers is context: the range of what followed similar setups, so a decision maker can plan for a range instead of betting on a point. The spread between those lines is usually the real lesson.
| Mon | No major scheduled releases; watch for any Fed speaker commentary following last week's hike, since any hint of the pace of future moves would shift the 2-year Treasury, which has already climbed 28 basis points in eight trading days. |
| Tue | S&P Global US PMI flash estimates for September: a reading below 50 in services, which has been the economy's growth engine, would be the first hard sign that high rates are slowing the sectors credit markets are treating as bulletproof. |
| Wed | New home sales for August: with the 30-year mortgage rate jumping to 6.95% in a single week, a sharp drop here would confirm that rate-sensitive consumer spending is softening faster than the aggregate retail number suggests. |
| Thu | Initial jobless claims for the week ending September 19: last week's 196,000 reading was the cleanest labor market print in months, and any reversal toward 220,000 or above would be the first signal that the Fed's hikes are reaching the employment data. |
| Fri | August PCE price index, the Fed's preferred inflation measure: if core PCE prints above 0.3% month over month, the 'inflation is resolving itself' thesis that tight credit spreads are implicitly betting on takes a direct hit. |
Free Research
The economy moves fast. We make sure you move faster.
Economic data, policy shifts, and market signals — delivered to your inbox.
Subscribe Free