
Lenders are charging more for risk. Stocks haven’t noticed.
Lenders Are Charging More for Risk. Stocks Have Not Noticed.
On the surface, the economy looks functional. Growth sits near its historical midpoint. Retail sales rose 0.77% in September. Industrial production is up 2.89% over the past year. If you read only the headlines, you might conclude things are fine.
But the bond market is running a different story. Credit spreads, which measure how much extra interest lenders charge to take on corporate risk versus safe Treasuries, are wide and moving wider. The 10-year Treasury sits at 5.1%, a level that was last normal in the early 2000s. Consumer Staples are beating the broad market by 5.3 percentage points over the past month while Technology lags by 2.7 points. Institutional investors, the people moving billions, are rotating out of growth and into safety at a pace that is not noise. These two pictures cannot both be right at the same time.
In this brief: why credit spreads are a more reliable leading indicator than equity prices, what the defensive rotation is actually pricing, and the one mechanism that connects rising borrowing costs to slower business investment before any layoffs show up.
Lenders Are Charging More. Investors Are Not Listening Yet.
The Gap Between the Income Statement and the Balance Sheet
Most economic coverage focuses on the income statement: sales, revenue, job growth, GDP. Those numbers tell you what happened last quarter. The balance sheet story, which is about rates, debt loads, and the cost of refinancing, tells you what happens next.
Right now the income statement looks adequate. Retail sales are running at $745 billion a month. Industrial production is growing. Initial jobless claims came in at 199,000, well below the levels that historically accompany layoffs. If you ran a business and looked only at your revenue line, you might feel comfortable.
But your credit line is getting more expensive. Credit spreads, the gap between what businesses pay to borrow and what the government pays, are wide and still moving wider. That matters because it changes the math on every forward-looking investment. When lenders charge more to take on corporate risk, the threshold a new project must clear in order to justify its financing cost goes up. Projects that looked profitable at tighter spreads get shelved. Hiring plans tied to expansion get deferred. None of that shows up in payroll data immediately. It shows up in capital expenditure decisions made quietly over the next one to three quarters.
What the Lenders Know That the Equity Market Has Not Priced Yet
Bond investors and equity investors are looking at the same economy, but they have different relationships with the downside. An equity investor participates in upside; a lender does not. Lenders get paid back at par or they take a loss. That asymmetry makes credit markets structurally more sensitive to balance sheet stress, and it is why ON1010's standing framework leans toward what bonds are saying when bond and equity narratives diverge.
Right now the 10-year Treasury yields 5.1% and the Fed's target rate sits at 3.75% to 4.0%. The 10-year breakeven inflation rate, which is the bond market's implicit forecast for inflation over the next decade, sits at 2.35%. Strip that out and you get a real long-term rate well above 2%, which is genuinely restrictive by any historical standard. Producer prices jumped 1.11% in a single month in September. Import prices are up 7.79% over the past year. The inflation pipeline has not cleared, which means the Fed has limited room to ease even as credit conditions tighten.
That is the trap: inflation still too elevated to cut rates, borrowing costs high enough to compress margins, and a credit market that is already repricing the risk. Historically, from similarly restrictive real rate environments, recessions began within the following 12 months about 18% of the time. That is not the most likely outcome, and our own walk-forward research across comparable historical setups shows the following 12 months were positive about 81% of the time, above the long-run base rate of 74%. But 18% is not a tail risk. It is a number that belongs in any serious capital allocation conversation.
Where Institutions Are Actually Putting Money
The sector rotation this month is not subtle. Consumer Staples are outperforming the broad market by 5.3 percentage points. Health Care is outperforming by 4.8 points. Utilities are ahead by 1.7 points. Three of four defensive sectors are beating the index simultaneously, while Technology, Financials, and Communication Services all lag. SPY itself sits below its 50-day moving average, and the VIX has risen from a 20-day average near 15.7 to just under 20, a meaningful jump in the price of insurance.
This is not retail investors getting nervous. Sector rotation at this scale and breadth reflects institutional repositioning: large allocators deciding that the risk-reward on earnings-leveraged, rate-sensitive growth plays has deteriorated and moving capital toward businesses whose revenues do not depend on economic acceleration. Staples companies sell soap and groceries regardless of the cycle. Health care demand does not compress in a slowdown.
The honest read here is that markets are not predicting a crash. They are repricing growth assets to reflect a higher cost of capital and wider uncertainty. The income statement can stay adequate while the balance sheet story tightens, and the sequence matters. Businesses cut investment before they cut workers, and lenders tighten terms before businesses cut investment. That chain is already in its early stages.
What would change this picture: a sustained decline in credit spreads, evidence that producer and import price pressures are easing rather than persisting, or margin data from the current earnings season showing that companies are absorbing higher borrowing costs without compressing their returns on investment. Any one of those would shift the weight of evidence. None of them are visible yet.
When credit spreads widen while equity prices hold, the credit market has historically been the earlier and more reliable signal, and right now lenders are charging more to take on risk while institutional investors quietly rotate toward businesses that do not need a strong economy to survive.
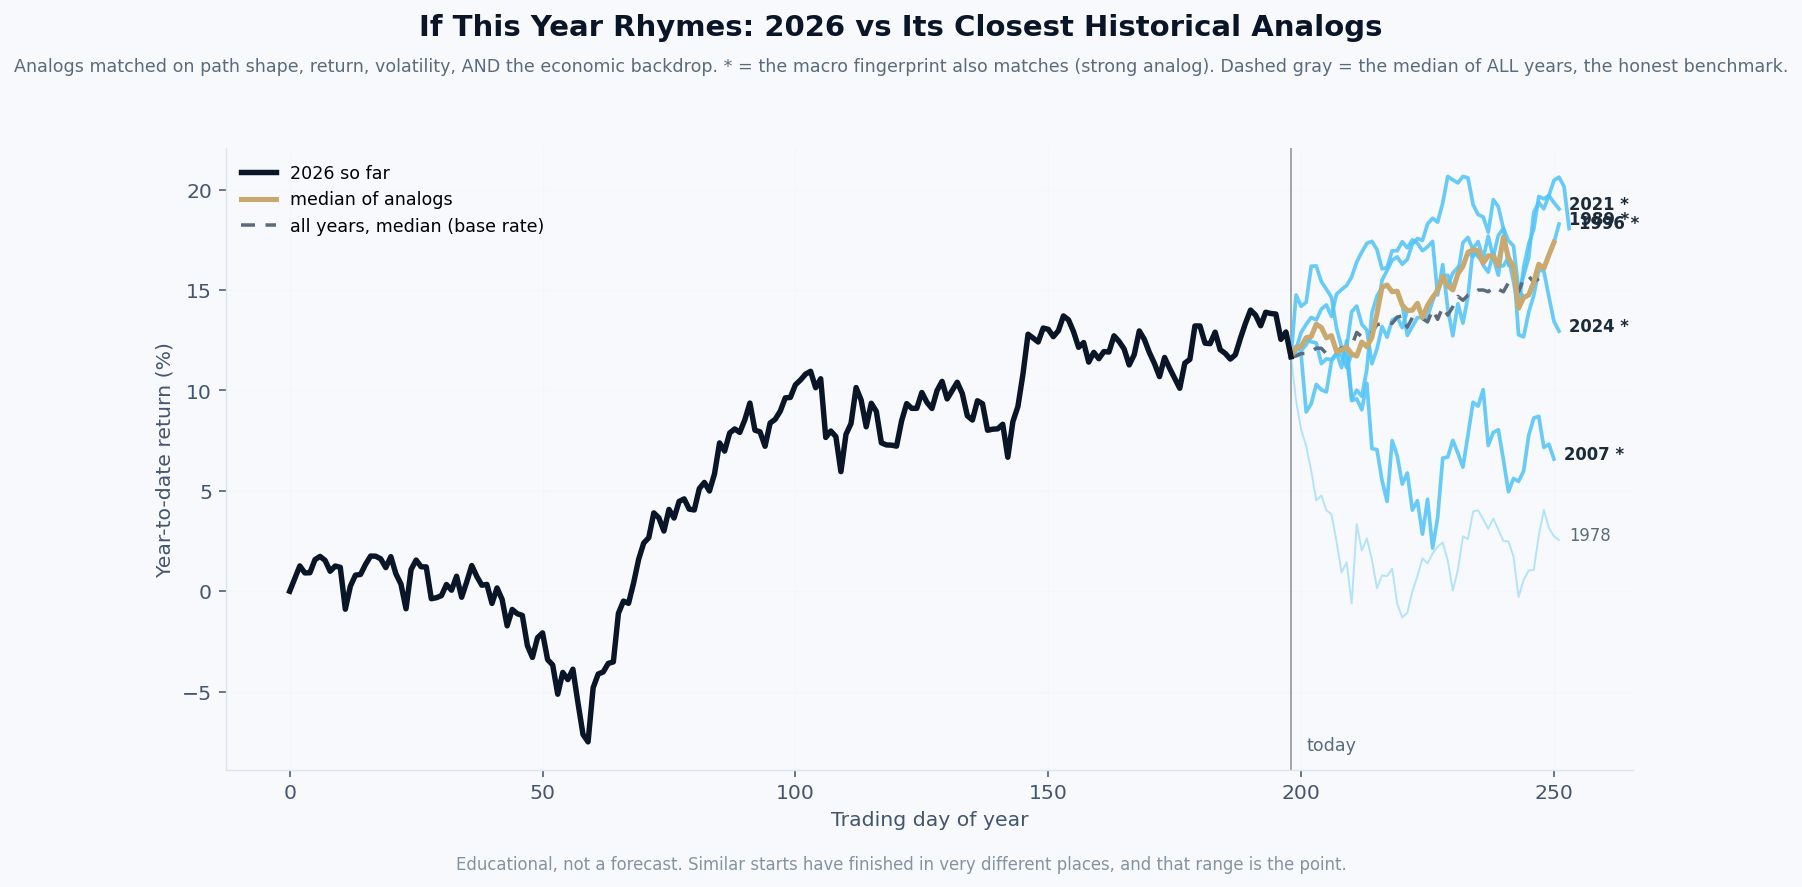
By this week's economic fingerprint, 2026 most closely resembles 1978, then 1989.
What it is. The black line is this year’s market path so far. Each colored line is a past year that our model ranks among the most similar to this one, matched on the shape of the path, its volatility, and the economic backdrop: inflation, interest rates, credit, employment, and more. A star means the economic fingerprint matches especially closely.
How it is built. Rebuilt every week from seventy years of data, using only information that was actually available at each point in history. The years are ranked by the model, not chosen by us.
What it is not. A prediction. Our own testing shows this tool has no ability to forecast where the market finishes the year, and we publish that finding on purpose. What it offers is context: the range of what followed similar setups, so a decision maker can plan for a range instead of betting on a point. The spread between those lines is usually the real lesson.
| Mon | No major scheduled releases, watch for any Fed speaker commentary, since a hawkish tone would push the 10-year yield higher and tighten the credit spread story further. |
| Tue | Housing Starts for September: a weaker reading would confirm that 7.4% mortgage rates are already killing new construction activity and removing one of the last sources of goods-sector employment momentum. |
| Wed | Beige Book release from the Federal Reserve: anecdotal reports from regional business contacts will either corroborate or push back against the defensive rotation signal, watch for any language around deferred investment or tighter lending standards. |
| Thu | Initial Jobless Claims for the week ending October 17: if claims rise meaningfully above 220,000, the labor market softness visible in September's 29,000 payroll print starts looking like a trend rather than noise. |
| Fri | Any preliminary October PMI data: a reading below 50 would confirm that the manufacturing cycle peak we identified in September is now rolling over, pulling the credit stress story from the balance sheet into the income statement. |
Free Research
The economy moves fast. We make sure you move faster.
Economic data, policy shifts, and market signals — delivered to your inbox.
Subscribe Free