
The Fed never won. Now oil is calling that bluff.
The Fed Never Got Real Rates Positive Enough and Oil Is Now Calling That Bluff
Gas at the pump hit $4.16 a gallon last week, up 33% from a year ago. Crude crossed $100 a barrel as markets priced in the possibility that the U.S.-Iran conflict near the Strait of Hormuz escalates further. That is a supply shock arriving on top of an inflation problem the Fed has not yet solved: consumer prices rose 0.4% in August alone, pushing the year-over-year rate to 3.05%, and producer prices are running nearly 5% above last year. The Fed's policy rate sits at 3.5% to 3.75%. Inflation is running at 3.05% on the consumer side and much hotter upstream. The cushion between policy and prices is almost nothing.
At the same time, traders have pushed the probability of a Fed rate hike at next week's meeting to 70%. The 10-year Treasury yield jumped to 4.95% in a single session this week. The 2-year yield hit 4.56%. Lenders are demanding more return to own government bonds, which means every business borrowing against those yields is paying more too. And yet credit spreads, the extra premium lenders charge to take on corporate risk above the Treasury rate, remain near historic tights. Lenders are pricing almost no corporate distress even as the absolute cost of money climbs. Both cannot stay true forever.
In this brief: what the oil shock does to the Fed's math, why the credit market's calm is the real puzzle, and what businesses refinancing debt or committing to capital projects need to understand about this rate environment.
The Fed Is Behind the Curve. Oil Just Made It Worse.
Start with the arithmetic, because the arithmetic is the argument.
The Fed's policy rate sits between 3.5% and 3.75%. Consumer inflation is running at 3.05%. That gap is barely half a percentage point. In plain terms, the Fed is charging borrowers a real interest rate, after inflation, of less than half a percent. Historically, genuinely restrictive monetary policy means the policy rate sits meaningfully above the inflation rate, close to two percentage points or more. This cycle never got there. The Fed eased before inflation was beaten, and now inflation is creeping back up while energy costs add fresh pressure from outside.
Crude oil above $100 a barrel is not just a gas price story. It runs through the entire cost structure of the economy. Trucking costs more. Plastics cost more. Fertilizer costs more. Airlines pay more. And those costs arrive with a lag: producer prices are already running nearly 5% above last year, which means the pipeline to consumer prices has not fully flushed through yet. The IEA warned this week that global refining capacity is stretched to its limit, which means even if crude prices stabilize, refined product prices stay elevated. The 10-year breakeven inflation rate, which measures what the bond market expects inflation to average over the next decade, ticked up to 2.36% this week. That is above the Fed's 2% target, and it has been drifting higher, not lower.
What the Bond Market Is Actually Saying
The 10-year Treasury yield jumped to 4.95% this week, and the 2-year yield hit 4.56%. When short rates and long rates both move up sharply in the same session, it is not a growth story. It is an inflation story. Bond investors are demanding higher yields because they expect inflation to persist, which erodes the purchasing power of every fixed coupon they collect. A bond that pays you $50 a year is worth less in real terms when prices are rising at 3% than when they are rising at 2%. So investors sell, prices fall, and yields rise.
The yield curve, measured as the gap between 10-year and 2-year Treasuries, sits at 0.33%. That is a positive spread, meaning longer-term bonds yield more than shorter ones, which is the normal shape of a healthy economy. But the spread has been narrowing this week, and the direction matters as much as the level. When that gap compresses while both yields are rising, it reflects a bond market caught between two pressures: near-term rate hike risk on the short end, and long-run inflation risk on the long end. Lenders are not predicting a recession. They are pricing a Fed that stays tighter for longer than many had hoped.
The Puzzle in the Credit Market
Here is where the picture gets complicated. Corporate credit spreads, the extra yield lenders demand above Treasury rates to extend loans to businesses, sit near historic tights. Lenders are charging almost nothing extra to take on corporate risk. That is what credit looks like when nobody is worried about defaults.
But the absolute cost of corporate borrowing is high, because Treasuries themselves are high. A company paying a 1% spread over a 5% Treasury yield is still paying 6%. In 2020 that same company might have paid 6% too, but on a different math: a wider spread over a near-zero Treasury rate. Today's tightness in spreads reflects confidence in corporate earnings and cash flows. The level of rates reflects something else entirely: a bond market repricing for a world where inflation does not return to 2% quickly.
We looked at every month going back to the 1950s where growth sat near its long-run midpoint, inflation was hotter than roughly nine of every ten months on record, and long-term rates occupied the upper quarter of their historical range. From those setups, a new recession began within the following twelve months about 19% of the time. That is not the majority outcome, but it is nearly one in five. And in those cases, the credit market's calm did not last: spreads widened as the rate level eventually found corporate balance sheets. Historically, when spreads start moving from historic tights, they move fast.
What Changes the Calculation
Two things would shift this picture materially. First, an oil price reversal. Crude pulled back sharply on Friday, snapping a multi-day winning streak, which is a reminder that a war premium can deflate quickly if the geopolitical temperature drops. If energy prices retreat and hold lower, the producer price pipeline clears faster, and the Fed's inflation math improves. Second, a sustained softening in services inflation, which drives the core numbers and which the Fed watches most closely. Core CPI rose only 0.29% in August, the smallest monthly gain in over a year. If that trend holds, the Fed's case for another hike weakens even as energy adds noise.
For anyone making capital commitments right now: the hurdle rate for new investment is genuinely high. The cost of rolling short-term debt or refinancing at maturity is real at today's yields. Any project that penciled out at 2021 borrowing costs deserves a fresh look at current rates. A qualified financial professional familiar with your specific situation is the right person to work through that math.
Oil above $100 handed the Fed an inflation problem it cannot hike its way out of quickly, and any business that borrowed cheap and faces near-term refinancing is now operating with a thinner margin than the credit market's calm surface suggests.
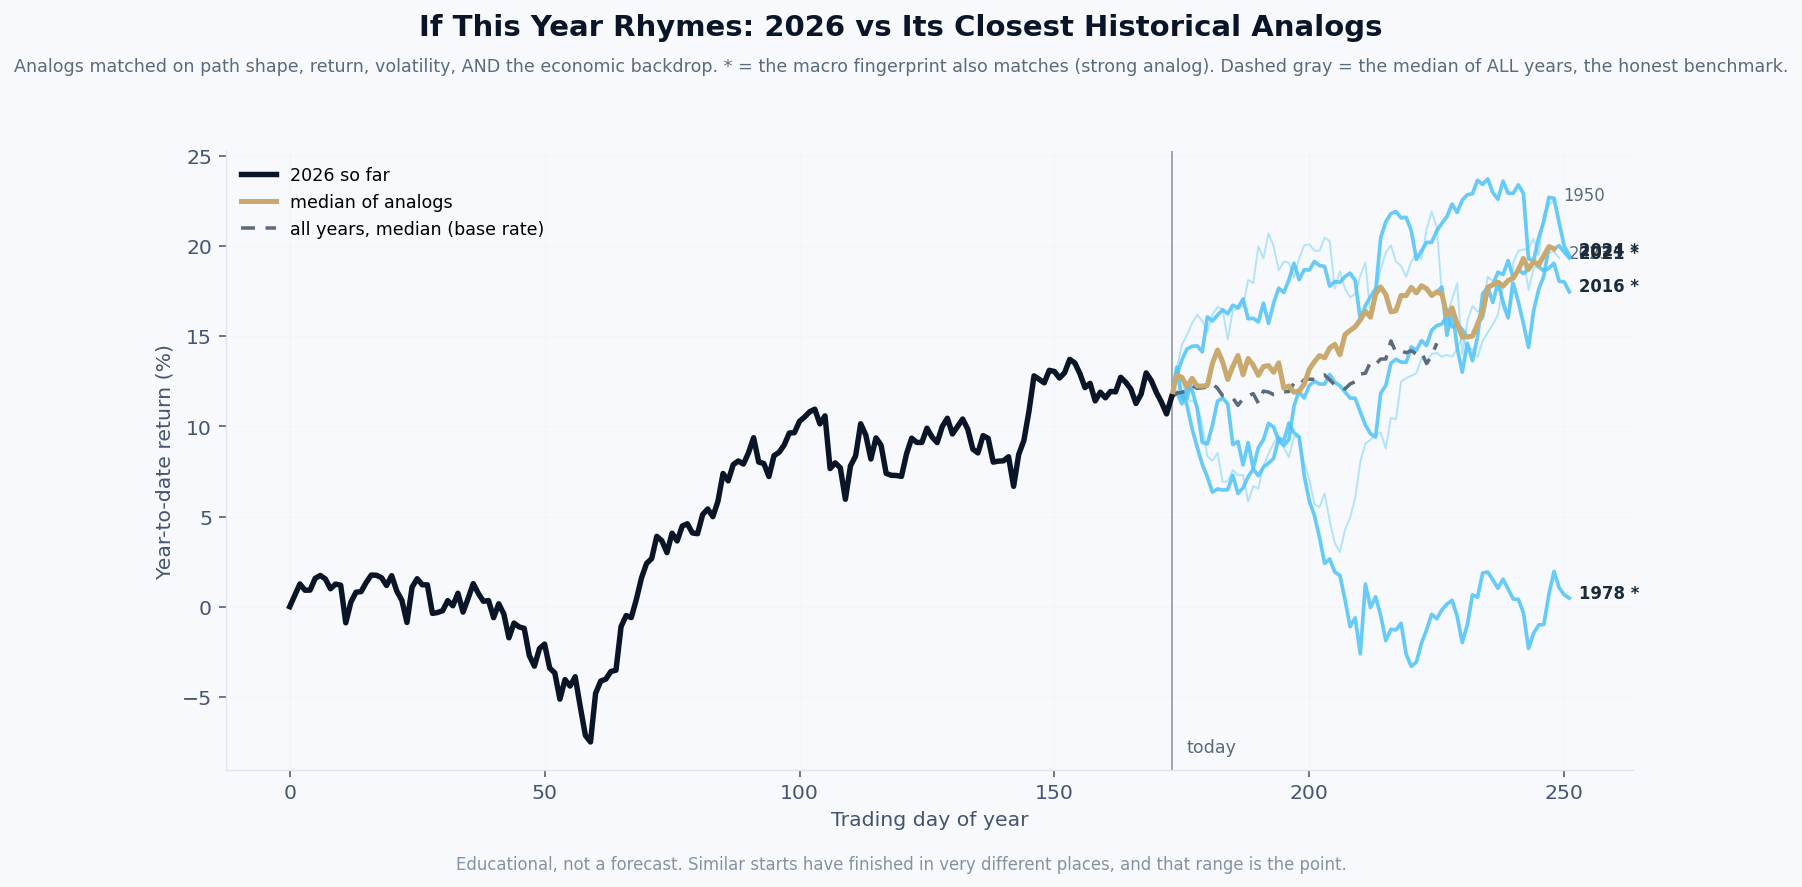
By this week's economic fingerprint, 2026 most closely resembles 2023, then 1978.
What it is. The black line is this year’s market path so far. Each colored line is a past year that our model ranks among the most similar to this one, matched on the shape of the path, its volatility, and the economic backdrop: inflation, interest rates, credit, employment, and more. A star means the economic fingerprint matches especially closely.
How it is built. Rebuilt every week from seventy years of data, using only information that was actually available at each point in history. The years are ranked by the model, not chosen by us.
What it is not. A prediction. Our own testing shows this tool has no ability to forecast where the market finishes the year, and we publish that finding on purpose. What it offers is context: the range of what followed similar setups, so a decision maker can plan for a range instead of betting on a point. The spread between those lines is usually the real lesson.
| Tue | September retail sales: a soft number would suggest consumers are pulling back under the weight of $4.16 gas, which would complicate the Fed's inflation-versus-growth tradeoff heading into next week's meeting. |
| Wed | FOMC rate decision: with traders pricing a 70% chance of a hike, any pause accompanied by a hawkish statement would likely push the 10-year yield higher and tighten financial conditions further for business borrowers. |
| Wed | Fed Chair press conference: the language around energy inflation and the path of rate cuts will do more work than the decision itself, since markets are already pricing in prolonged tightness. |
| Thu | Initial jobless claims: at 206,000 last week, claims are historically low; any move above 230,000 would be the first credible sign that the labor market is beginning to soften under the pressure of higher rates. |
| Fri | University of Michigan consumer sentiment (preliminary): sentiment is already historically depressed, but if the inflation expectations component rises alongside the $4.16 pump price, the Fed's anchoring argument gets harder to make. |
Free Research
The economy moves fast. We make sure you move faster.
Economic data, policy shifts, and market signals — delivered to your inbox.
Subscribe Free