
Someone is eating a 4-point cost gap that GDP ignores
Consumer Prices Rose 3.7%. Input Costs Rose 8.1%. Someone Is Eating That Difference.
The economy grew at a 3.4% annual rate in the third quarter, business investment surged nearly 20%, and consumers kept spending at nearly a 4% clip. By most readings, this is a strong economy. The bond market is suggesting something less comfortable: the 10-year Treasury has pushed back above 5%, lenders are charging more to take on risk, and every major defensive sector, staples, healthcare, utilities, real estate, has outrun the broader market by seven points or more over the past month while technology and communication services have fallen more than eight points behind. One of those pictures is right. They cannot both be.
The tension resolves when you look upstream from the GDP report. Producer prices are running at 6.3% year-over-year. Import prices are up 8.1%. Consumer prices are running at 3.7%. When the costs flowing into businesses rise twice as fast as the prices they can charge customers, the gap comes out of profits. And profits, not GDP, are what drive hiring decisions, capital commitments, and expansion plans. The headline can look strong while the machinery underneath it quietly seizes.
In this brief: where the margin squeeze is actually showing up, why the bond market's message and the sector rotation are telling the same story, and what the historical record says about economic cycles when input costs run this far ahead of output prices.
Input Costs Are Outrunning Prices. Margins Pay the Difference.
Start with the arithmetic. Businesses buy inputs, labor, energy, components, imported goods, and sell outputs at whatever price the market will bear. When input costs rise faster than output prices, the middle is squeezed. That middle is the profit margin. And margins are not just an accounting line: they are the signal that tells a business whether to hire, invest, expand, or pull back.
Right now, producer prices, what businesses pay before anything reaches a consumer, are up 6.3% over the past year. Import prices are up 8.1%. Core producer prices, which strip out food, energy, and trade services to isolate the underlying trend, are still up 5% year-over-year. Set those numbers next to consumer prices running at 3.7%, and the picture comes into focus. Businesses are absorbing roughly two to three percentage points of cost they cannot pass through to customers. That gap does not disappear. It shows up as narrower margins.
The Cost Pipeline Does Not Respect the GDP Headline
A substantial share of those import price increases traces directly to semiconductor and AI hardware costs. Chip prices are surging even as chip volumes hold roughly flat, meaning the price surge is almost entirely demand-driven, not supply-constrained in the usual sense. That matters for the Fed's ability to fix the problem. Monetary policy controls domestic credit conditions. It does not control the price of a chip produced in Taiwan or South Korea. When a meaningful slice of inflation arrives through the import channel, tighter rates at home cannot resolve it, and the duration of the inflation constraint extends.
For businesses with floating-rate debt or refinancing coming due, that extension is not abstract. Credit spreads, the extra cost lenders charge above risk-free rates to take on corporate exposure, are wide and still moving. Wide spreads mean lenders are demanding a bigger share of the winnings precisely when earnings visibility is lowest. A company that needs to roll debt this year is paying more both because the base rate (the fed funds rate, holding at 3.75-4.0%) is high and because the spread above that base rate has widened. The two stack.
Retail Spending Looks Solid Until You Examine What People Are Actually Buying
Consumer spending grew at a 3.8% annual rate in the third quarter, and that number has generated a lot of confidence about the economy's resilience. But where households are spending matters as much as how much they are spending. The strength in retail has been concentrated in healthcare, nondurables, and food, not in furniture, appliances, or vehicles. Spending on necessities under price pressure is not the same as discretionary demand. One reflects financial flexibility; the other reflects the absence of it.
Wage growth has decelerated from 3.9% twelve months ago to roughly 3.1% today. Total compensation including hours worked is running around 4.1%, which means longer hours in manufacturing are partially keeping income whole, but that is a fragile buffer. If order volumes soften and hours get cut, the income hit arrives faster than any payroll decline would show. Against inflation still running at 3.7%, real purchasing power is thin. And the personal saving rate has been falling for six straight months, meaning households are spending from a shrinking buffer, not from income growth.
What the Sector Rotation Is Actually Saying
Institutional investors reposition faster than economic data is released. When all four defensive sectors beat the market by seven to twelve points while technology and communication services fall eight points behind, that is not noise, it is a repricing of where earnings will hold and where they will not. The historical parallel is instructive: defensive leadership of this uniformity has typically appeared when institutional money has concluded that revenue growth and margin expansion, the two inputs to future hiring and investment, are under pressure.
The market's overall trend remains technically intact. The S&P 500 trades above its 200-day moving average, which historically has meant positive twelve-month returns about 80% of the time from comparable macro configurations. A recession within the next twelve months looks unlikely based on our historical testing, roughly an 11% base rate against a 15% all-history average. But the trend and participation measures are deteriorating, and historically those two things do not stay in disagreement for long.
The honest read: growth is real, the consumer is still spending, and business investment surged in Q3. The risks are upstream and lagged. Businesses that borrowed cheaply to invest aggressively when rates were low are now refinancing into a different world. Producers absorbing cost increases that consumers cannot fully cover will eventually stop absorbing them, through price increases that renew inflation, layoffs that slow spending, or investment pullbacks that slow future growth. Which of those channels opens first is what the next few quarters will answer.
When producer prices run nearly double consumer prices, the gap comes out of profits, and profits are what businesses use to decide whether to hire, invest, or pull back.
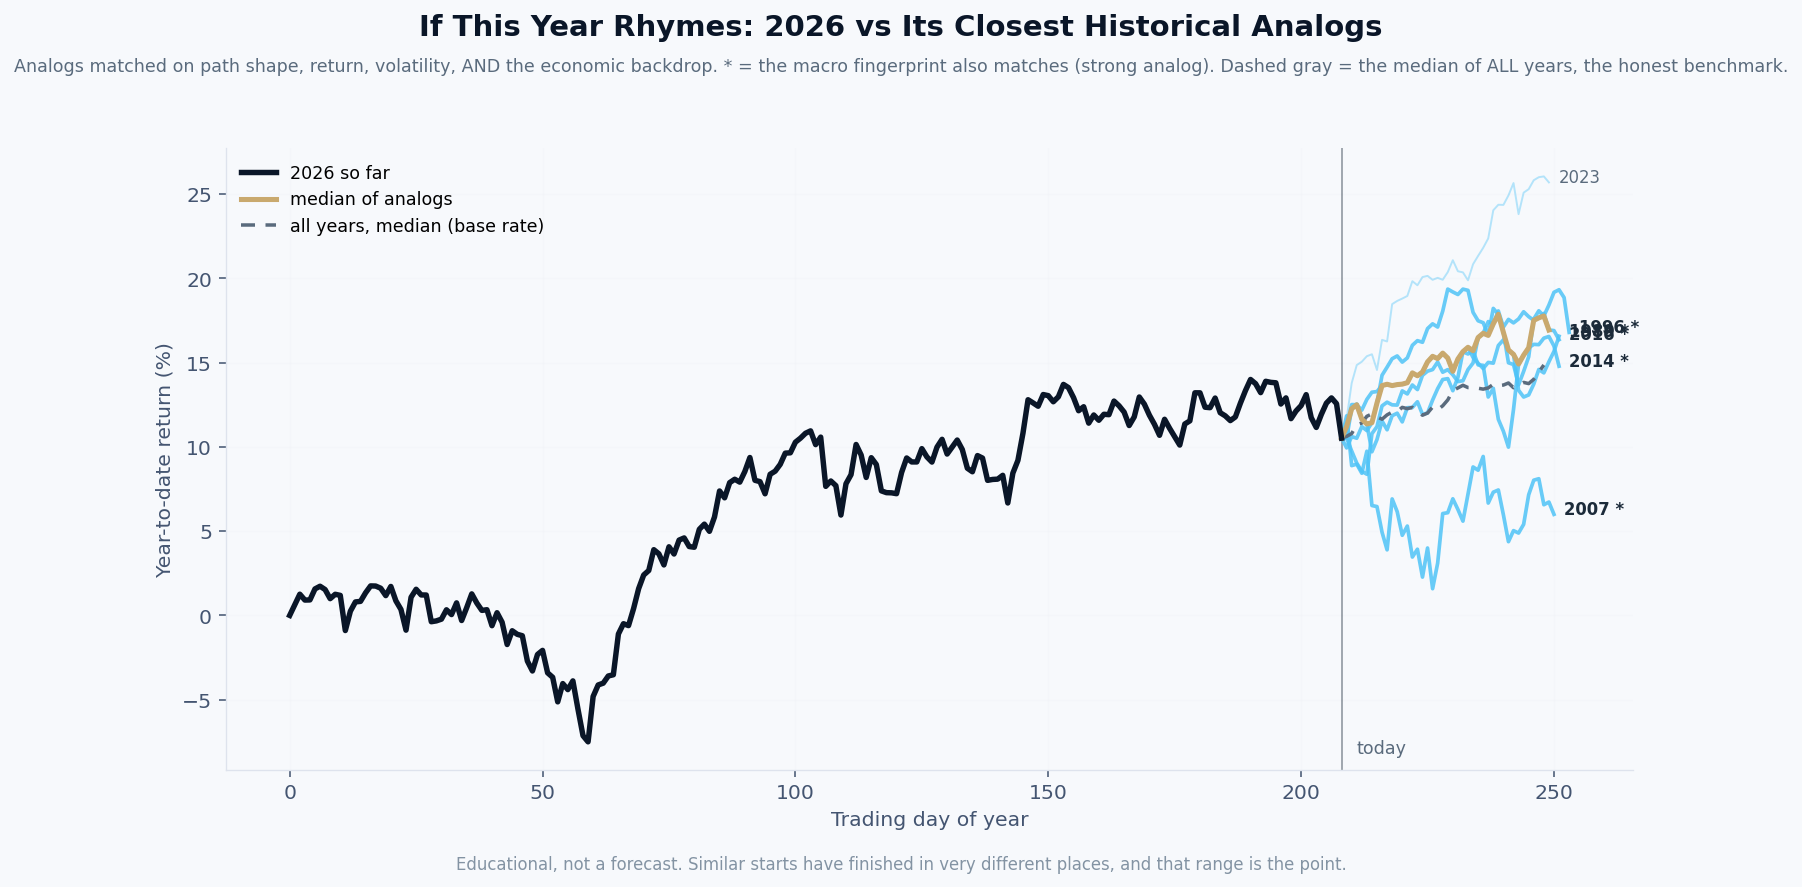
By this week's economic fingerprint, 2026 most closely resembles 2007, then 2014.
What it is. The black line is this year’s market path so far. Each colored line is a past year that our model ranks among the most similar to this one, matched on the shape of the path, its volatility, and the economic backdrop: inflation, interest rates, credit, employment, and more. A star means the economic fingerprint matches especially closely.
How it is built. Rebuilt every week from seventy years of data, using only information that was actually available at each point in history. The years are ranked by the model, not chosen by us.
What it is not. A prediction. Our own testing shows this tool has no ability to forecast where the market finishes the year, and we publish that finding on purpose. What it offers is context: the range of what followed similar setups, so a decision maker can plan for a range instead of betting on a point. The spread between those lines is usually the real lesson.
| Mon | ISM Manufacturing Index for October, if new orders weaken further, it would confirm that the investment surge in Q3 did not carry into Q4, which changes the earnings outlook for industrial and materials companies. |
| Tue | JOLTS Job Openings for September, a drop in openings would signal that businesses are already trimming labor demand in response to margin pressure, before it shows up in payrolls. |
| Wed | ISM Services Index for October, services account for roughly 70% of the US economy, so a reading below 50 (contraction) would undercut the consumer resilience story more than almost any other single data point this week. |
| Thu | Initial Jobless Claims, the labor market has been remarkably stable near 194,000 claims, and any sustained move above 220,000 would shift the conversation from margin compression to active labor market deterioration. |
| Fri | October Nonfarm Payrolls, the headline number will be watched, but the more important read is average hourly earnings; if wage growth holds near 3.1% against inflation still above 3.5%, real wages are flat and the consumer's spending buffer keeps shrinking. |
Free Research
The economy moves fast. We make sure you move faster.
Economic data, policy shifts, and market signals — delivered to your inbox.
Subscribe Free